Fleet Management

Understanding leading vs lagging indicators is essential for any organization that wants to improve health and safety performance. Many companies still rely too heavily on lagging indicators such as injury rates, recordable incidents, and lost-time cases. Those metrics matter, but they only tell you what has already happened.
Leading indicators in health and safety help organizations identify whether the right preventive actions, behaviors, and systems are in place before an incident occurs. When used together, leading and lagging indicators give safety leaders a more complete picture of risk, performance, and improvement opportunities.
This guide explains the difference between leading vs lagging indicators in health and safety, why both matter, examples of each, and how to build a balanced safety measurement system.
In health and safety, indicators are measurable data points used to track performance and risk.
Lagging indicators are metrics that measure events that have already occurred. They reflect the end result of past safety performance.
Common lagging indicators include:
Lagging indicators are often the most familiar safety metrics because they are widely reported, easy to benchmark, and important for compliance and executive reporting.
Leading indicators are metrics that measure activities, behaviors, systems, and conditions that influence future safety outcomes.
Common leading indicators include:
Leading indicators help organizations understand whether they are doing the things that reduce risk before harm occurs.
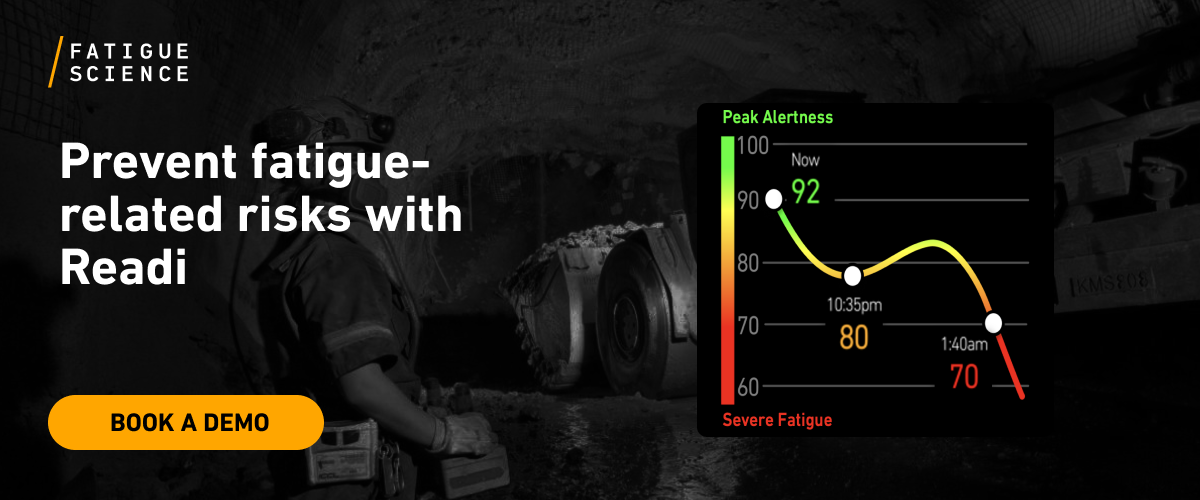
In safety-sensitive industries, fatigue is often one of the most important risks to measure proactively. That is why fatigue risk data can serve as a strong leading indicator in health and safety. Unlike lagging indicators such as fatigue-related incidents, injuries, or vehicle collisions, a fatigue risk score helps organizations identify elevated risk before an event occurs.
Readi is an example of a fatigue risk management solution that can function as a leading indicator by helping organizations measure predicted fatigue exposure in advance of safety-critical work. Instead of waiting until fatigue contributes to poor decision-making, reduced alertness, or an incident, organizations can use Readi data to identify when workers or drivers may face elevated fatigue risk and take preventive action.
This makes Readi useful as a leading indicator because it can help organizations track:
In this way, Readi can complement other leading indicators such as supervisor check-ins, fit-for-duty processes, schedule reviews, and fatigue education. It gives safety leaders a more proactive way to monitor one of the most important hidden contributors to health and safety incidents.
The simplest way to understand leading vs lagging indicators is this:
| Category | Leading Indicators | Lagging Indicators |
|---|---|---|
| Focus | Prevention | Outcomes |
| Time orientation | Future-focused | Past-focused |
| Purpose | Predict and improve | Measure results |
| Example | Safety inspections completed | Recordable injuries |
| Management style | Proactive | Reactive |
| Question answered | Are we reducing risk? | What happened? |
This distinction matters because a company can go months without a recordable injury and still have serious unmanaged risk. In the same way, a company can improve its leading indicators and still need time before those improvements show up in lagging results.
A common mistake in health and safety is assuming one category is better than the other. In reality, both are necessary.
Lagging indicators matter because they show whether people were harmed, operations were disrupted, or incidents occurred. They help organizations:
If an organization ignores lagging indicators, it may miss evidence that its safety system is not working.
Leading indicators matter because they allow organizations to take action before an incident occurs. They help leaders:
If an organization ignores leading indicators, safety becomes too dependent on waiting for bad outcomes to reveal problems.
| If you use only this | What you miss |
|---|---|
| Lagging indicators only | Early warning signs, control quality, prevention effectiveness |
| Leading indicators only | Confirmation that efforts are actually reducing harm |
| Both together | A balanced view of risk, action, and results |
Leading indicators should measure meaningful drivers of safety performance, not just activity for activity’s sake. The best leading indicators connect to known hazards, operational controls, and risk reduction priorities.
Tracking how many hazards are identified, reported, and addressed can show whether workers are actively engaged in risk detection.
It is not enough to identify issues. Safety improves when actions are closed on time and verified.
Training completion can be a useful leading indicator when the training is role-relevant and tied to critical risk.
Supervisor observations, coaching sessions, and field interactions can show whether safety expectations are being reinforced consistently.
In safety-sensitive environments, equipment condition is a major driver of risk. Maintenance completion is often a powerful leading indicator.
Near misses provide insight into exposures and weak controls before an injury occurs.
Routine workplace, vehicle, or equipment inspections help verify that hazards are being identified before they lead to incidents.
In transportation, mining, and other safety-sensitive sectors, fatigue screening or risk assessments can serve as strong leading indicators.
Where work permits are used, tracking compliance can show whether critical controls are functioning.
Not just whether meetings occurred, but whether actions from those meetings were completed.
| Leading Indicator | What It Measures | Why It Matters |
|---|---|---|
| Hazard reports submitted | Risk identification activity | Shows workforce engagement |
| Corrective actions closed on time | Follow-through | Shows whether issues are being resolved |
| Supervisor safety conversations | Frontline leadership involvement | Reinforces safe behavior |
| Pre-start inspection completion | Operational discipline | Helps catch issues early |
| Near-miss reports | Exposure visibility | Identifies weak controls before injury |
Lagging indicators measure safety events after they happen. These are often the metrics executives know best, but they should be interpreted with care.
A standard measure of recordable injuries and illnesses.
Tracks injuries serious enough to cause time away from work.
Measures how serious injuries are, often using lost workdays.
Provides insight into injury costs and health impacts.
Shows safety failures even when no injury occurred.
Especially important in fleet and transportation safety.
Useful in process and industrial safety.
May indicate broader trends even if they are less severe.
Shows when employees can work only in a limited capacity after injury.
Critical lagging indicators that demand immediate review.
| Lagging Indicator | What It Measures | Limitation |
|---|---|---|
| Recordable incident rate | Injury frequency | Does not show root causes by itself |
| Lost-time injuries | Serious injury outcomes | May stay low even when risk is high |
| Severity rate | Impact of incidents | Reactive and outcome-based |
| Claims cost | Financial consequence | Often delayed |
| Vehicle collisions | Driving-related events | Does not reveal all precursor conditions |
Many organizations still judge safety success mainly by injury rates. That creates several problems.
If leaders wait for injury metrics to worsen before acting, risk may go unmanaged for too long.
A site can report no injuries for a period of time while still having poor housekeeping, weak supervision, fatigue exposure, or uncorrected hazards.
When organizations focus too heavily on injury-free statistics, employees may feel pressure not to report incidents or first-aid cases.
They show that something happened, but not always why it happened or what needs to change upstream.
A transport operation may report no recent collisions, but if it also has:
then its true safety risk may be increasing even though lagging indicators look stable.
Leading indicators are valuable, but they are not automatically meaningful.
Completing training or inspections does not guarantee risk is actually reduced.
If leaders track only counts, people may focus on volume rather than quality.
A safety dashboard with dozens of weak indicators can distract from critical risk priorities.
A leading indicator is only useful if it reflects something that truly influences safety performance.
An organization may report:
but still experience repeated serious incidents because the indicators measured administrative activity instead of critical risk control quality.
The best leading indicators are not generic. They should be tied to the actual risks in your operation.
| Question | Example |
|---|---|
| What is the risk? | Driver fatigue |
| What prevents harm? | Sleep education, schedule controls, fit-for-duty checks |
| What can we measure? | Fatigue checks completed, schedule exception reviews |
| What result do we want? | Fewer fatigue-related incidents |
A strong dashboard includes both leading and lagging indicators and makes the relationship between them visible.
These show where the organization may be vulnerable.
Examples:
These show whether key controls are functioning.
Examples:
These show whether harm or disruption occurred.
Examples:
| Dashboard Area | Example Metrics |
|---|---|
| Exposure | Overtime, fatigue risk, high-risk shifts |
| Prevention | Inspections, training, action closure, audits |
| Behavior | Safety observations, coaching, reporting participation |
| Outcomes | Recordables, lost-time injuries, collisions |
This kind of balanced view helps leaders ask better questions. Instead of just asking, “Did we have injuries?” they can ask, “Were our controls weakening before the event happened?”
The right mix of indicators depends on the industry and the type of risk.
Leading indicators
Lagging indicators
Leading indicators
Lagging indicators
Leading indicators
Lagging indicators
Too many metrics reduce attention and ownership.
Executives may need high-level trends, while frontline supervisors need practical, local indicators.
A single month of data may not tell the full story.
If hazard reports drop while incidents rise, that may indicate underreporting or reduced engagement.
Metrics without explanation can be misleading.
Indicators should support learning and prevention, not just punishment.
As risks change, your safety indicators should evolve too.
Low incident rates do not always mean low risk.
Not every completed task is a strong leading indicator.
Poor reporting makes both leading and lagging indicators less useful.
Indicators only help if someone is accountable for action.
In many environments, safety risk is driven by scheduling, workload, staffing, and equipment condition.
Imagine a commercial transportation company wants to improve driver safety.
The company tracks only:
That means leaders only know about safety failures after they happen.
The company tracks lagging indicators plus leading indicators such as:
Now the organization can detect signs of elevated risk earlier and intervene before collisions occur.
| Approach | What the company learns |
|---|---|
| Lagging only | How many bad events happened |
| Leading only | Whether prevention activities are occurring |
| Both combined | Whether prevention activities are reducing real-world incidents |
The debate around leading vs lagging indicators in health and safety should not be about choosing one over the other. Strong safety management requires both.
Lagging indicators are essential because they show the real outcomes of safety performance. Leading indicators are essential because they show whether the organization is doing the work needed to prevent those outcomes.
The most effective health and safety systems use lagging indicators to understand what happened and leading indicators to shape what happens next.
If your organization wants to improve safety performance, the goal is not just to count injuries more accurately. The goal is to build a measurement system that helps leaders detect risk earlier, strengthen controls faster, and prevent harm more consistently.
Leading indicators measure activities and conditions that help prevent incidents. Lagging indicators measure incidents and outcomes that have already happened.
No. They serve different purposes. Leading indicators support prevention, while lagging indicators confirm results. The best safety programs use both.
Examples include hazard reports, corrective action closure rates, pre-start inspections, safety observations, and fatigue risk assessments.
Examples include recordable injuries, lost-time injuries, collision rates, workers’ compensation claims, and severity rates.
They help organizations identify weak controls, improve preventive action, and intervene before incidents happen.
In many organizations, near-miss reporting is treated as a leading indicator because it provides early insight into risk exposure before injury occurs.
There is no universal number, but most organizations benefit from tracking a focused set of meaningful indicators rather than a large number of weak ones.
One of the biggest mistakes is relying too heavily on lagging indicators and assuming low injury rates always mean low risk.