
Product News
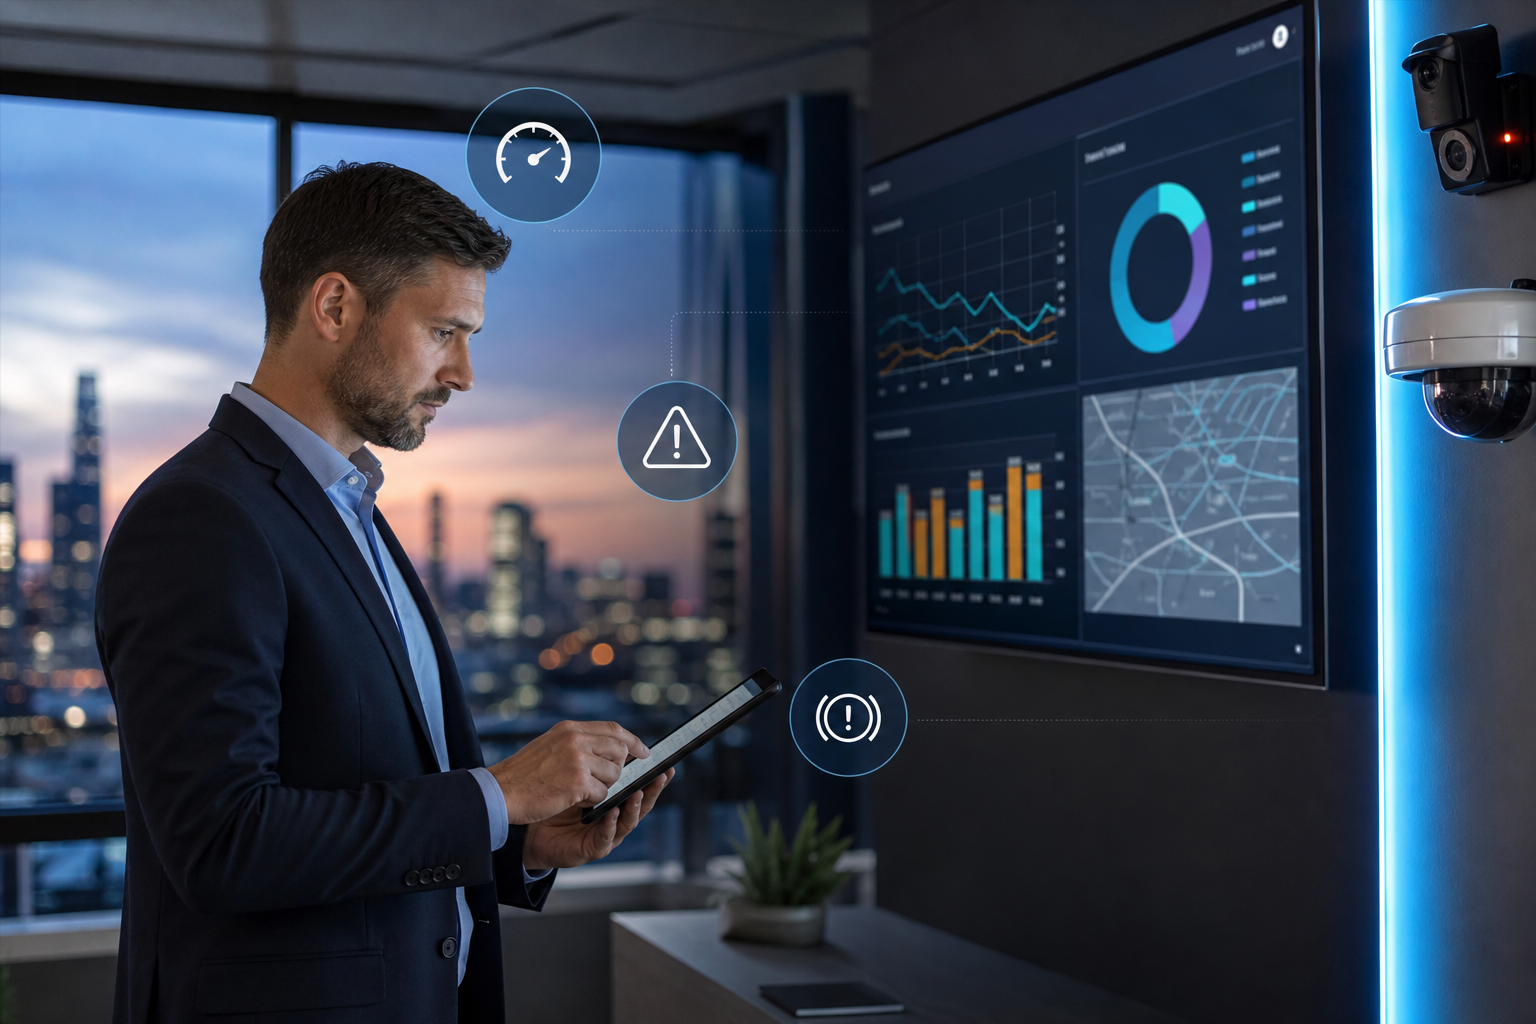

Driver behavior monitoring gives fleet managers more visibility than ever into what happens behind the wheel. Telematics systems, ELDs, GPS platforms, dash cameras, and other fleet safety technologies can identify speeding, harsh braking, rapid acceleration, sharp cornering, seat belt violations, and other behaviors associated with risk.
But collecting more driver data does not automatically make a fleet safer.
The real value comes from driver behavior analytics: understanding what the data means, identifying why risky patterns are occurring, and turning those findings into actions that improve safety and driver performance.
That requires looking beyond individual events.
A harsh braking alert tells you what happened. A camera may tell you what the driver was doing when it happened. But neither necessarily explains why the driver's risk was elevated in the first place.
Mental fatigue is one important part of that missing context.
For fleets operating overnight, across irregular schedules, or with long duty periods, fatigue risk can develop before a driver starts showing unsafe behavior on the road. Predictive fatigue technology such as Readi adds a leading indicator to the reactive information generated by traditional telematics and camera systems.
The result is a more complete approach to driver behavior monitoring: measure what happened, understand why it happened, and identify risk early enough to do something about it.
Driver behavior monitoring is the process of collecting and analyzing data about how drivers operate vehicles in order to identify unsafe patterns, assess risk, and improve performance.
A driver behavior monitoring system typically collects information from technologies such as:
Common driver performance metrics include speeding, harsh braking, rapid acceleration, sharp cornering, idling, seat belt use, hours driven, time of day, and event severity.
Strong programs, however, go further than monitoring these events individually.
They combine event data with context such as route, schedule, workload, time of day, and fatigue exposure. This helps safety teams distinguish between a behavioral issue requiring coaching and an operational risk that may require changes to scheduling, dispatch, breaks, or task assignment.
That distinction matters.
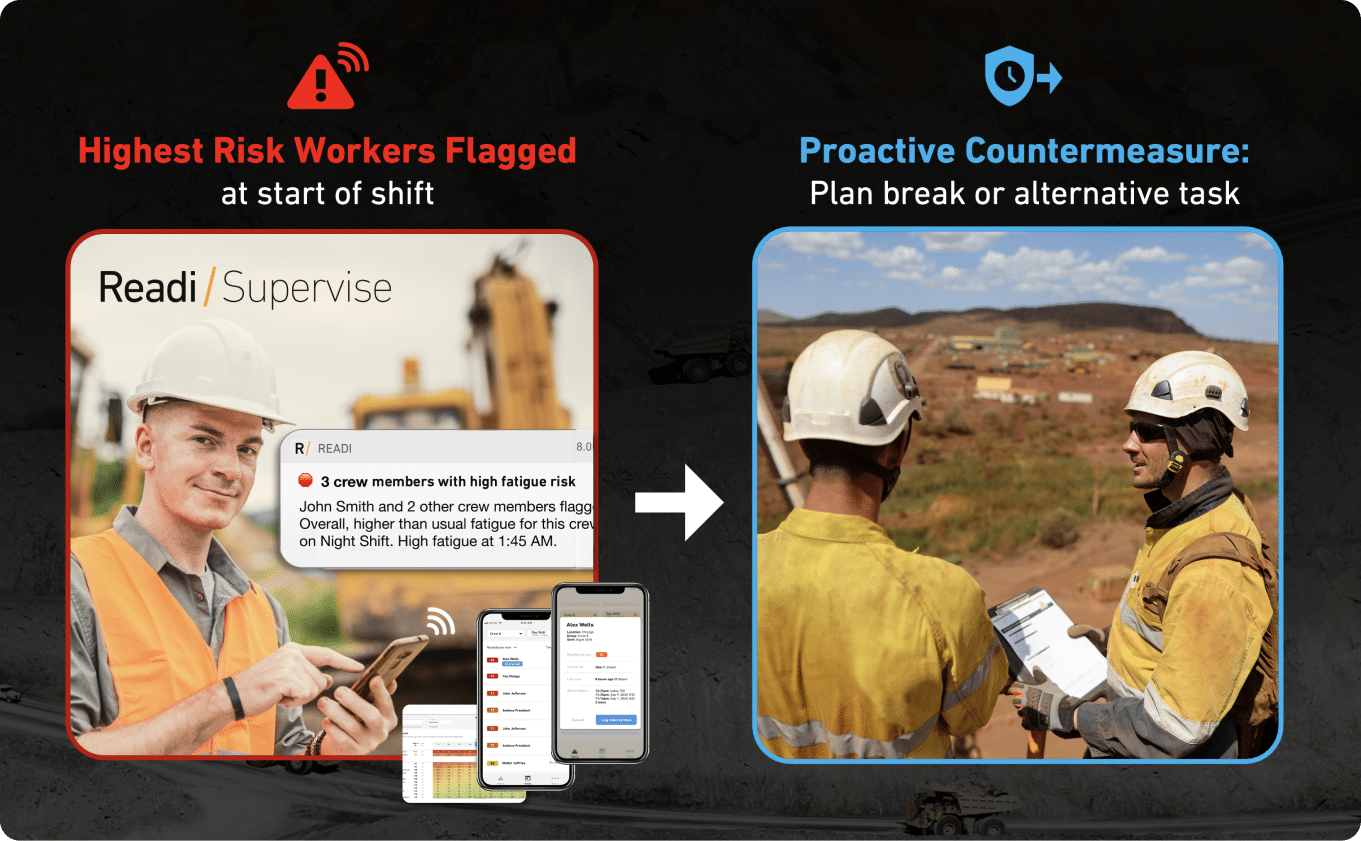
Readi, for example, uses ELD and schedule information as inputs to personalized fatigue predictions, enabling fleets to identify elevated driver fatigue risk before driving begins rather than waiting for an unsafe event on the road.
For fleets evaluating driver behavior analysis, the objective should therefore be bigger than simply detecting undesirable driving.
It should be understanding where risk is building and what intervention is most likely to reduce it.
Effective driver behavior monitoring should turn large volumes of fleet data into a relatively small number of useful decisions.
The goal is not another dashboard.
The goal is to determine:
The following process can help.
Start with the business problem, not the data.
Before opening a telematics dashboard, decide which safety or operational outcomes you are trying to change.
Your priorities might include:
Then identify the driver performance metrics most closely connected to those outcomes.
Depending on your fleet safety technology, you may track:
Avoid putting every available metric on your primary safety scorecard.
When everything becomes a KPI, nothing receives enough attention.
Instead, select a small number of behaviors with a demonstrated relationship to safety, operational cost, or performance. Then establish a clear baseline before making changes.
Driver behavior analytics becomes more useful when data from multiple systems is considered together.
That might mean connecting information from:
Each record should ideally be associated with the correct:
Driver + vehicle + route + shift + timestamp.
That becomes particularly important in operations where multiple drivers use the same truck.
You also need exposure data.
For example, Driver A might generate 20 harsh braking events while Driver B generates 10. It would be easy to conclude that Driver A is twice as risky.
But what if Driver A drove 10,000 miles while Driver B drove only 2,000?
Analyzing incidents per 1,000 miles, per 100 driving hours, or per trip gives safety teams a much more useful comparison than raw totals.
The same principle applies to fatigue.
ELDs are valuable sources of Hours of Service and work/rest data, but regulatory compliance by itself does not determine whether an individual driver is adequately rested. Drivers can experience different fatigue levels despite operating within the same Hours of Service limits because sleep opportunity, circadian timing, schedule changes, and individual sleep patterns vary.
Adding driver fatigue monitoring to your analysis can therefore provide context that traditional driver event data does not.
Poor-quality data creates poor-quality coaching.
Before comparing drivers, clean the information being produced by your driver behavior monitoring systems.
Look for:
Standardization is especially important when multiple fleet safety systems are being used.
A "harsh braking" event in one platform may not use exactly the same threshold as another.
Next, organize data into useful segments such as:
Contextual variables may also matter.
Weather, road type, load characteristics, traffic conditions, dispatch requirements, and unusual operational conditions can all influence driver behavior.
If these factors are ignored, safety scorecards can incorrectly label an operational problem as a driver problem.
That undermines trust in the program and makes coaching less effective.
Event counts alone rarely tell the whole story.
Four characteristics are generally more useful:
Frequency: How often is the behavior occurring?
Severity: How serious are the individual events?
Recurrence: Is the behavior repeating after intervention?
Trend: Is performance improving or getting worse?
Metrics should also be normalized by exposure whenever possible.
Instead of comparing total speeding events, for example, calculate speeding events per 1,000 miles or 100 hours driven.
Safety scorecards should also recognize that different behaviors carry different levels of risk.
One severe event may deserve more attention than ten minor deviations.
Finally, compare like with like.
A driver operating a long-haul overnight route should not automatically be benchmarked against someone driving short daytime routes in low-density traffic.
Good driver behavior analysis connects driving events with their operating conditions rather than reducing every driver to a single number.
This is where driver behavior analytics becomes considerably more powerful.
The same employee can appear to be a low-risk driver on one shift and a high-risk driver on another.
Break your data down by:
Then ask whether risky events are clustering at predictable times.
For example, do camera fatigue alarms increase late in overnight shifts?
Does speeding increase on particular assignments?
Do harsh braking events cluster toward the end of long duty periods?
Are several drivers experiencing the same problem on the same route or schedule?
This is important because driver behavior monitoring should not assume every unsafe event is caused by poor driver attitude or skill.
Risky driving can also reflect:
Fatigue deserves particular attention because it can impair reaction time, cognitive effectiveness, and the ability to avoid lapses or microsleeps. Readi's ReadiScore is specifically designed to predict these dimensions of cognitive fatigue on an hour-by-hour basis.
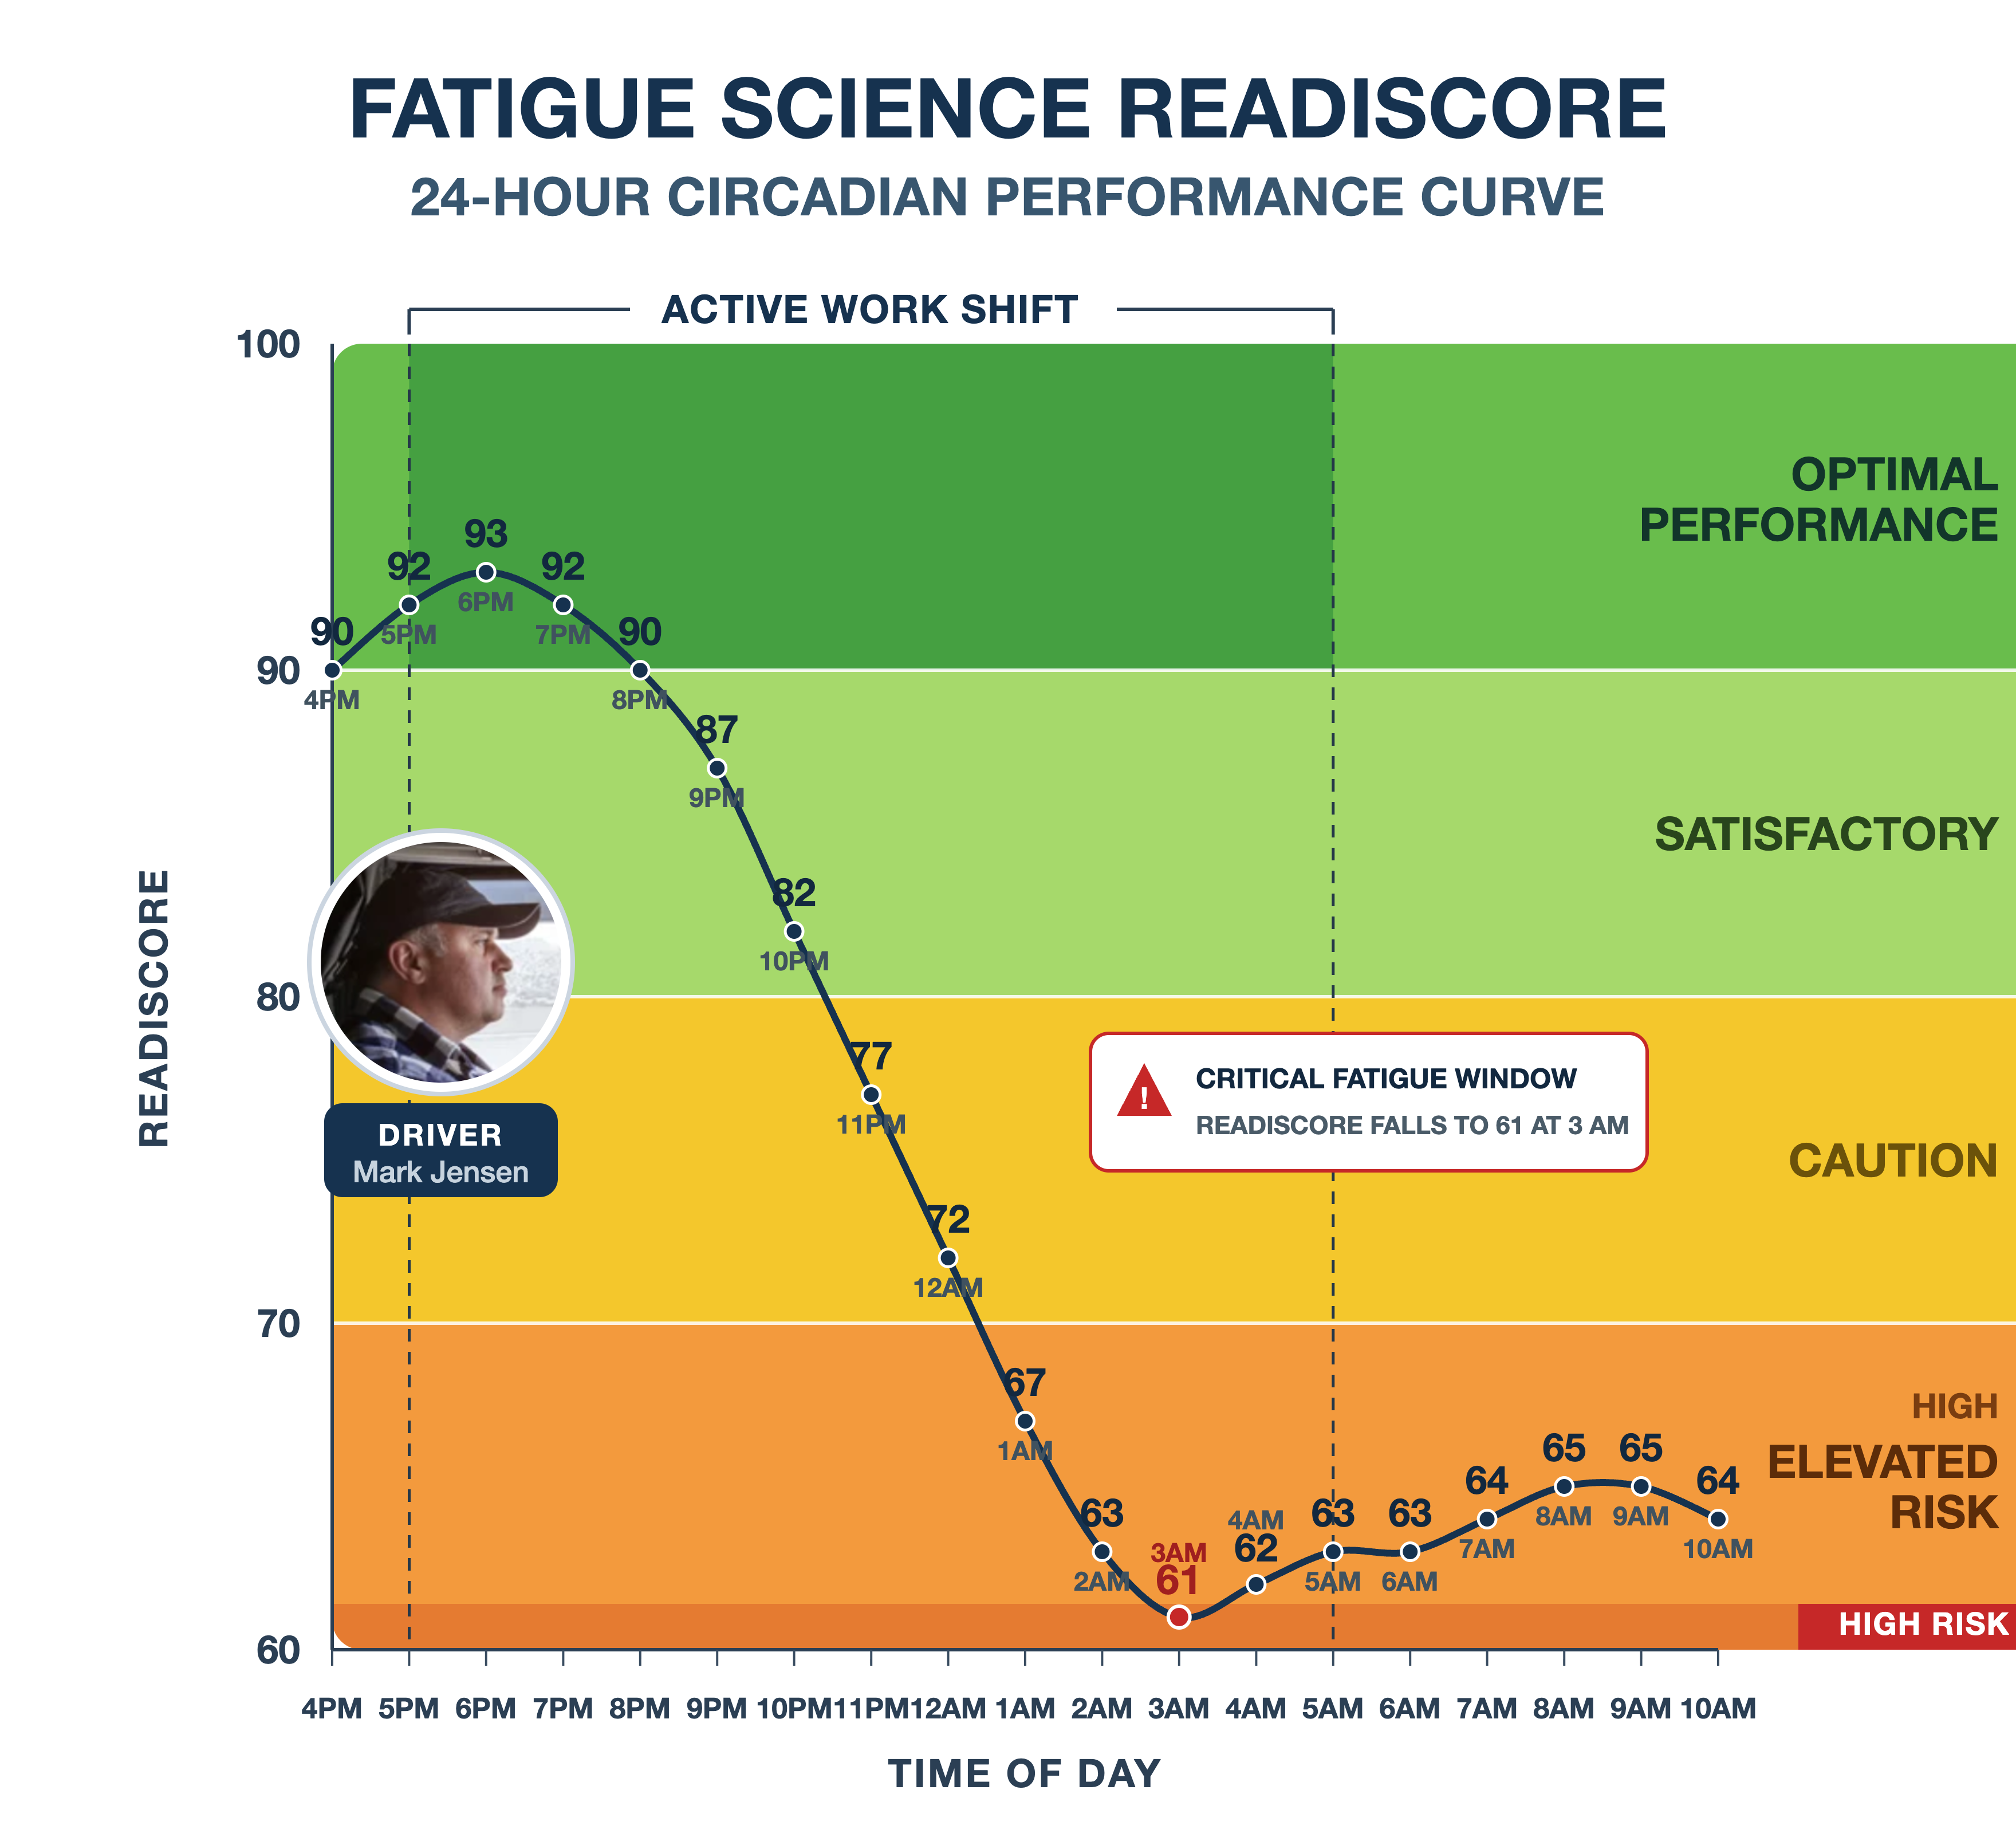
Traditional in-cab fatigue cameras play an important safety role, but they are fundamentally reactive: an observable fatigue event must begin before the system can detect it.
Predictive fatigue technology adds an earlier layer.
Readi generates personalized fatigue predictions for drivers before and during the shift, allowing dispatchers and safety teams to identify higher-risk periods and apply countermeasures before fatigue escalates into a camera alarm or safety event.
That makes predictive fatigue management complementary to cameras and telematics, not a replacement for them.
Reactive systems tell you when something is happening.
Predictive systems help you see risk coming.
Fleet-wide averages frequently hide the information safety managers need most.
Instead, segment drivers into meaningful comparison groups.
Examples include:
You can also segment by route, terminal, supervisor, vehicle class, or schedule.
The objective is to answer an important question:
Is the problem associated with the driver, or with the operating environment?
Imagine that a single driver repeatedly speeds on several routes while peers do not. That may indicate a coaching opportunity.
Now imagine that 40% of the drivers assigned to one route generate similar speeding events.
That points toward a different investigation.
The issue might involve unrealistic trip times, dispatch pressure, road design, congestion, or another operational factor.
Likewise, if fatigue risk consistently rises across a group of overnight drivers, adjusting schedules, breaks, or assignments may produce better results than sending every driver through the same retraining program.
Segmentation makes driver coaching programs more targeted—and more defensible.
Analysis only creates value when somebody acts on it.
Build a clear response workflow around the patterns you identify.
A simple process is:
Review the event → confirm the context → identify the likely cause → choose the intervention → record the action → measure the result.
Different causes should trigger different responses.
Potential action:
Potential action:
Potential action:
This is where predictive fatigue management software becomes especially valuable.
Readi is designed to predict when individual drivers are likely to experience elevated fatigue risk during the shift ahead. Readi can use machine learning and information such as ELD or schedule data to generate personalized fatigue predictions without requiring every driver to wear a device.
That creates an important shift in fleet safety:
Instead of waiting for unsafe behavior and then coaching it, fleets can intervene before predictable risk translates into unsafe behavior.
Every intervention should eventually answer one question:
Did it work?
Compare performance before and after the intervention using consistent metrics and time periods.
Track indicators such as:
Look at both leading and lagging indicators.
Lagging indicators tell you what already happened:
Leading indicators tell you where risk is developing:
Combining the two gives safety teams a better way to evaluate whether interventions are addressing root causes instead of simply reducing alerts temporarily.
ReadiAnalytics can also help operations and HSE teams examine fatigue exposure at an organizational level, identify hotspots, monitor trends, and evaluate the impact of fatigue-management initiatives.
As the program matures, revisit your thresholds and scorecard weights.
A driver behavior monitoring program should evolve as fleet performance improves.
Most driver monitoring technologies begin with the vehicle.
Readi begins with the driver.
Readi uses the scientifically validated SAFTE™ biomathematical model to translate sleep and circadian factors into personalized predictions of cognitive effectiveness, reaction time, and lapse likelihood.
For transportation fleets, machine learning can estimate sleep inputs using operating information such as ELD and schedule data, meaning organizations can deploy predictive fatigue management without requiring wearables for every driver.
The difference is fundamentally one of timing.
Telematics: What did the vehicle do?
Camera systems: What did the driver just do?
Driver behavior analytics: What patterns are appearing?
Predictive fatigue analytics: When is the driver likely to become higher risk?
Used together, these systems provide a more complete view of fleet safety.
That is the core advantage of combining driver behavior monitoring with predictive fatigue management: fleets no longer have to rely entirely on events that occur after risk has already reached the road.
If your fleet is evaluating new driver behavior monitoring technology, look beyond the number of alerts the system can generate.
Consider whether it provides:
For organizations where fatigue is a meaningful risk, ask one more question:
Can the system tell us which drivers are likely to become fatigued before they start exhibiting unsafe behavior?
If the answer is no, consider adding predictive fatigue intelligence rather than replacing your existing technology.
Readi was designed to fit alongside fleet safety systems—including ELDs and reactive camera technologies—to give safety teams predictive context before elevated fatigue becomes an event on the road.
A driver behavior monitoring system is technology that collects and analyzes information about how drivers operate vehicles. It may use telematics, GPS, ELD, camera, vehicle sensor, or other data to identify patterns such as speeding, harsh braking, rapid acceleration, distraction, or fatigue.
The best systems do more than generate alerts. They help fleet managers understand patterns, prioritize risk, and determine appropriate safety interventions.
Driver behavior monitoring improves fleet safety by making risky patterns visible.
Safety teams can identify recurring behaviors, compare trends, target coaching, investigate root causes, and determine whether interventions are reducing risk.
Combining reactive event data with predictive indicators such as fatigue can provide an even earlier opportunity to intervene.
Common metrics include:
Fleets should normalize relevant metrics by miles, hours, or trips so driver comparisons remain fair.
Focus supervisor attention on exceptions rather than every individual data point.
Prioritize severe events, recurring patterns, meaningful trend changes, and drivers with elevated risk.
Adding contextual information—including route, shift, schedule, and predicted fatigue—can also help supervisors determine which alerts require action.
The objective should be decision support, not alert volume.
Driver behavior monitoring primarily involves collecting and observing driver data.
Driver behavior analytics takes the next step by identifying patterns, relationships, causes, and trends in that information.
Monitoring tells you that five harsh braking events occurred.
Analytics asks whether those events are unusually frequent, whether they happen under similar conditions, what is contributing to them, and which intervention could reduce them.
Fatigue risk assessment tools add context about a driver's predicted cognitive condition.
That is useful because traditional telematics and camera systems primarily detect behaviors or events after they emerge.
Predictive fatigue tools such as Readi can identify elevated fatigue risk before the driver reaches the highest-risk portion of a shift, giving dispatchers or supervisors time to use countermeasures such as changing break timing, modifying an assignment, or choosing a lower-risk route.
Start with the outcome you need to improve.
Then evaluate:
For fleets already using cameras or telematics, the best next investment may not be another detection system. It may be technology that helps identify risk earlier.
Use scorecards to identify patterns, not to replace investigation.
Supervisors should validate the context behind an event, determine the probable cause, choose an appropriate intervention, and monitor subsequent performance.
When multiple drivers show the same pattern, investigate the operating environment before assuming the issue is individual behavior.
And where fatigue is involved, prioritize non-punitive countermeasures that reduce risk rather than treating fatigue solely as a disciplinary issue.
Driver behavior monitoring has made it easier to see what happens on the road.
The next step is understanding what happens before the event.
Telematics, cameras, ELDs, and vehicle tracking solutions remain important parts of modern fleet safety. But most of these technologies primarily provide evidence of behavior that has already occurred.
Predictive fatigue intelligence adds another layer.
Readi helps fleets use existing operational data to predict fatigue before shift start and throughout the shift ahead, giving dispatchers and safety teams an opportunity to act before fatigue contributes to unsafe driving.
No additional camera system.
Wearables are optional.
And Readi is designed to complement the fleet technology already in place.
Because the future of driver safety is not simply better monitoring.
It is knowing where risk is building early enough to prevent the event altogether.