Product News
Fleet Management


Predictive fatigue analytics for fleet safety in 2026 uses data-driven models and AI to forecast when driver fatigue risk will peak, giving fleet safety and operations teams the ability to intervene before a fatigue-related incident occurs. This approach represents a shift from reactive alert systems toward preventative fatigue management across commercial transportation.
Most fleet safety programs today rely on tools that detect risk after it has already appeared on the road. Cameras capture drowsy driving events. Telematics platforms flag harsh braking. ELD systems confirm hours-of-service compliance. Each of these tools plays a role, but none of them answer a critical operational question: will this driver be fit to perform safely during their upcoming shift?
That gap is where predictive analytics in transportation is gaining traction. Predictive fatigue analytics for fleet safety in 2026 focuses on modeling fatigue risk using factors like sleep timing, circadian biology, and schedule patterns. The goal is to give dispatchers and safety managers a leading indicator they can act on hours before a driver gets behind the wheel.
Fleet safety technology has matured quickly. The typical safety stack now includes ELDs, dash-cams, telemetry and driver safety platforms, and coaching workflows. What has been missing is a layer that connects the biological reality of driver fatigue to the operational decisions fleets make every day. Predictive fatigue analytics fills that role by scoring individual driver risk and surfacing it within existing workflows.
Key factors driving adoption of fatigue risk management systems in 2026 include:
As AI in fleet management matures, the most practical applications are those that fit into how fleets already operate. Predictive fatigue analytics for fleet safety in 2026 is defined by that principle: use the data fleets already collect, model risk using validated sleep science, and deliver actionable forecasts to the people who make scheduling and dispatch decisions.
Start with a narrow operating target: fewer sleep-loss crashes, fewer late-shift event spikes, and better use of the safety systems already in place across the fleet. A 2026 rollout should support preventative fatigue management with clear supervisor actions, measurable risk reduction, and stronger dispatch control.
The strongest programs place fatigue forecasts beside the tools managers already check before trucks move: duty records, route timing, video review queues, and driver event history. Cameras, ELD logs, and telematics show where risk surfaced on the road; a predictive layer adds a forward view so dispatch and safety teams can act before a high-risk assignment begins.
Each fatigue signal should connect to a specific operating choice. A high score before an overnight run may prompt a different start time, a route change, a manager check-in, or a revised break plan. That approach keeps AI in fleet management tied to daily supervision instead of one more report that sits outside normal workflow.
Early deployment works best with a limited operating group, such as linehaul, overnight regional routes, or drivers with irregular dispatch windows. That structure gives teams room to test thresholds, compare before-and-after event patterns, and tighten response rules before broader use.
Readi supports that kind of pilot with on-demand visibility into workforce fatigue risk and performance, plus decision support for resource allocation, task planning, worker training, and scheduling. It can forecast elevated risk in advance of shift, and in a large U.S. logistics pilot the Readi group recorded a 42% reduction in fatigue-linked in-cab telematics events, which gave supervisors a practical way to improve driver fatigue management without extra hardware or wearable adoption barriers.
The first review should focus on timing, not raw volume. A terminal with fewer total events can show a stronger fatigue signal when errors concentrate in narrow windows such as 1:00 a.m. to 5:00 a.m., after a second consecutive night run, or near the end of a return leg.
Start with telematics safety events that reflect delayed reaction or reduced control. Harsh braking, rapid acceleration, lane deviation, and drifting speed control often leave a clearer fatigue pattern when they are sorted by hour, route stage, and duty sequence rather than by driver score alone.
The next step is pattern mapping. Fatigue risk rarely spreads evenly across a fleet; it clusters around certain lanes, customer schedules, delivery promises, and dispatch windows that cut into normal sleep opportunity.
Look for repeat exposure in overnight freight, weather-heavy corridors, long monotony segments, and routes with strict appointment times that push drivers into biologically low hours. In logistics operations, minor public-road incidents and one major load-loss event can point to the same hidden cause long before a formal review labels fatigue as a factor. That makes route-level pattern review a practical entry point for driver fatigue management and fleet operations optimization.
A supervisor should not treat every unsafe event as a conduct problem. Two drivers may trigger the same harsh-braking alert, yet one case may involve aggressive driving while the other reflects reduced alertness after irregular dispatch times and repeated night work.
That distinction shapes the response. A behavior issue may need coaching or policy follow-up; a fatigue issue may require schedule change, route reassignment, break planning, or closer pre-trip review. This is where fatigue risk management systems begin to add value: they help safety and operations teams classify exposure more accurately, reduce mislabeling, and build a cleaner baseline for predictive analytics in transportation.
Once fatigue exposure has clear hotspots, the next step is record alignment. A workable program needs one dependable operating record for each driver and each duty period, built from electronic logging device exports, dispatch plans, duty status changes, route clocks, and in-cab event feeds.
Many carriers already collect these inputs. Trouble starts when dispatch, compliance, and safety each rely on a different driver ID, a different time source, or a different shift record; a model cannot sort real fatigue exposure from bad data when a load swap, split sleeper period, or late assignment sits under the wrong name.
Integration should take priority over more dashboards. In 2026, the strongest safety programs run on shared workflows that place the same driver record in front of dispatch, operations, and supervisors, which cuts review time and reduces false starts before a route begins.
Readi fits this approach because it gives operations teams and supervisors on-demand visibility into workforce fatigue risk and performance, then supports decisions on resource allocation, task planning, worker training, and scheduling from the same operating picture.
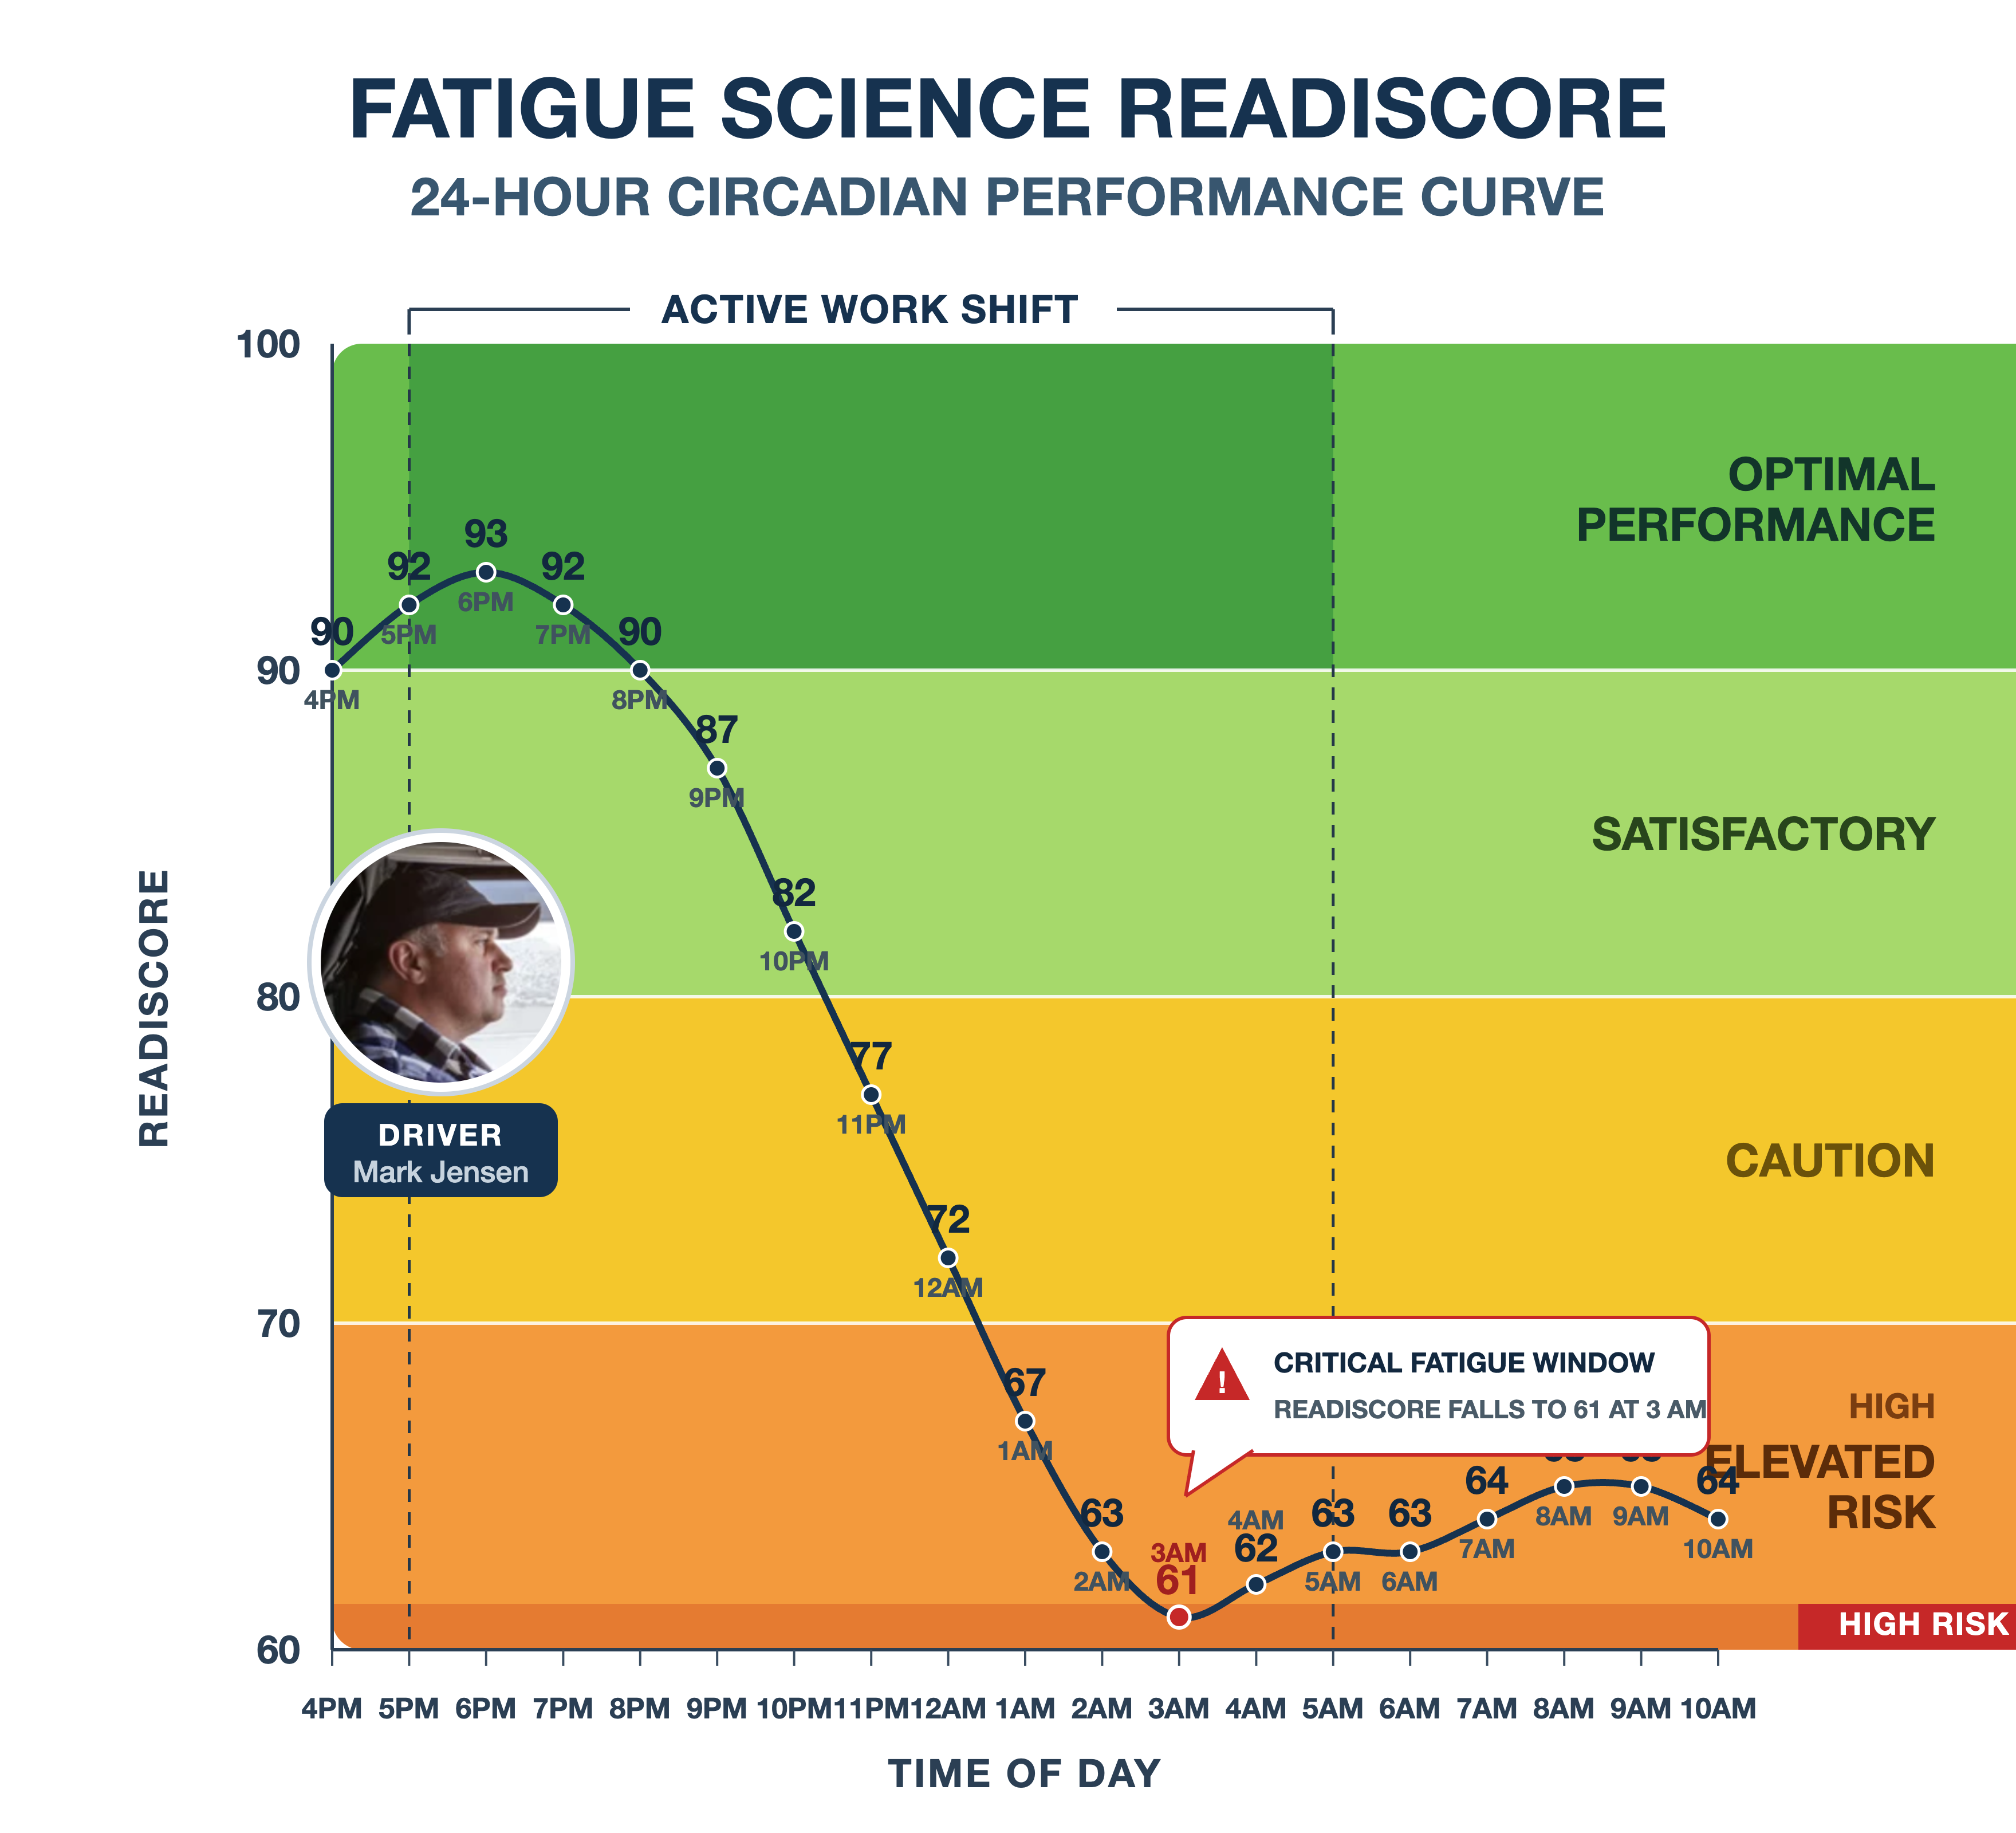
Hours-of-service records show legal availability; they do not show biological readiness. Two drivers can log the same duty status and carry very different risk levels because sleep quality, wake time, and body-clock timing shape reaction speed long before a camera event or hard-brake alert appears.
A useful model for predictive fatigue analytics for fleet safety in 2026 needs more than logbook totals. It should account for the factors that change human performance across a route or shift:
These inputs give predictive analytics in transportation a stronger base than HOS status alone. They help fleets separate a legal schedule from a safe schedule, which is a core requirement for driver fatigue management in safety-sensitive operations.
Shift work changes cognitive effectiveness in ways that show up on the road. Night freight, irregular dispatch windows, and early starts after short daytime sleep can reduce judgment, narrow attention, and slow response to traffic changes. The same pattern affects mine-support transport and other heavy-duty operations that run through the night under fixed production demands.
For fleet safety technology programs in 2026, this is the line between basic monitoring and real predictive fatigue analytics. When fatigue risk models combine sleep science with dispatch data, supervisors can review task plans, resource allocation, and schedule choices before risk turns into lane deviation, abrupt braking, or a preventable incident.
Once a fleet begins to score fatigue exposure, the output must match the pace of dispatch. Terminal leads need a ranked queue, a color band, or a simple exception flag beside each assignment so they can spot elevated risk before trucks leave the yard.
Dense charts, confidence intervals, and layered dashboards slow response. Supervisors work best with outputs that pair the fatigue signal with route type, start window, and duty plan so the action sits in the same screen as the operating choice; that is where predictive analytics in transportation starts to improve fleet operations optimization.
Readi follows this model. It gives operations managers and supervisors on-demand visibility into workforce fatigue risk and performance, informs resource allocation, task planning, worker training, and scheduling, and surfaces high-risk cases 18 hours in advance without added wearables or new in-cab hardware.
A fatigue score loses value when it stays in a separate tool outside the shift handoff. Risk needs to appear inside the dispatch board, driver assignment queue, and pre-trip review that supervisors already use to match people, loads, and route timing.
Front-line teams also need a triage model. Most drivers should move through the day with no extra review; only the small group with elevated exposure should trigger a hold, a manager check, or an assignment change before release. That structure keeps the process usable in busy terminals and supports stronger driver fatigue management.
Use simple operating rules so fatigue forecasts affect real dispatch choices instead of adding another report:
Readi supports this model with on-demand visibility for supervisors and operations leaders. The platform helps with resource allocation, task planning, worker training, and scheduling; it also gives teams a forecast 18 hours in advance, which creates enough time to swap a route, delay a release, or add relief coverage before reduced alertness affects vehicle control.
Pre-shift use also needs clear documentation. A short note in the dispatch record should capture the risk level, the action taken, and the reason a change was or was not made. That record supports consistent supervisor judgment, cleaner coaching follow-up, and a more disciplined fatigue risk management system across terminals.
When fatigue review sits inside the daily assignment process, it becomes part of normal transportation safety control.
The next step is connection. A fatigue forecast has the most value when it sits beside telematics event data, in-cab video, and driver coaching records, so safety teams can see which events carry higher fatigue exposure and which ones point to a different root cause. In practical terms, that means route timing, duty history, and alertness risk should appear in the same review flow as sudden deceleration, lane drift, over-correction, or distraction alerts.
A video clip on its own shows the moment of error. A risk signal adds operating context, such as overnight duty, shortened recovery, or irregular start windows, so the coach can judge whether the right fix sits with the driver, the route plan, or the schedule. That shift helps driver fatigue management stay operational and specific, which is where predictive analytics in transportation tends to produce better decisions.
This connected approach improves return on current safety investments because it narrows attention to leading indicators instead of raw alert volume. Readi supports that model with on-demand visibility into fatigue risk and performance, which helps supervisors make decisions on resource allocation, task planning, worker training, and scheduling without forcing them to sort through spreadsheets and disconnected systems. Across transportation safety trends 2026, the fleets with stronger preventative fatigue management programs tend to use real-time fatigue monitoring as a decision layer inside the tools they already use.
Once fatigue scores reach the dispatch desk, leader judgment becomes the control point. Dispatch, safety, and terminal staff need training on how sleep loss affects lane control, reaction time, memory, and decision quality, even when a driver sounds sharp in a short check-in. The curriculum should cover overnight duty, early-morning circadian lows, compressed reset windows, irregular start times, and fast schedule flips.
Readi gives supervisors on-demand visibility into workforce fatigue risk and performance, then helps guide decisions on resource allocation, task planning, worker training, and scheduling. That support is useful only when leaders know how to translate a score into a clear next step, which is why response training should sit beside the technology from day one. In AI in fleet management, the gain comes from better decisions across connected systems, not from another report that no one uses.
| Risk signal | Supervisor response | Record note |
|---|---|---|
| Elevated pre-shift score | Review route difficulty, duty length, weather, and delivery window; change the assignment when exposure is too high | Score level, route reviewed, final decision |
| Repeated high-risk overnight exposure | Send the case to the terminal or safety lead for schedule review | Route pattern, dispatch window, previous actions |
| High score plus recent harsh braking or lane events | Match the forecast to telemetry and driver safety records; set a follow-up with the driver and dispatcher | Event type, coaching step, next review date |
A solid playbook should remove guesswork. It should state who can delay a start, who can swap a load, when a route needs a second review, and when the issue moves to a higher level. Short documentation works best because leaders need speed and consistency, not a long narrative.
Trust decides whether the process holds. Drivers respond better when supervisors treat fatigue as a normal operating hazard, apply the same rules across the fleet, and use the process to support safer performance instead of discipline first.
After fatigue forecasts, dispatch rules, and supervisor actions take hold, the program needs proof. Fleet leaders need to see both the exposure that crews faced before a trip and the road outcomes that followed after a decision, schedule change, or check-in.
A useful scorecard puts early measures next to outcome measures so safety, operations, and risk leaders can judge whether pre-trip action changes what happens on the road.
| Metric | Measure type | Simple formula | What it shows |
|---|---|---|---|
| Elevated fatigue exposures | Early | High-risk shifts ÷ total shifts | How much fatigue risk the fleet carried across a period |
| High-risk dispatch decisions avoided | Early | Reassigned, delayed, or modified trips ÷ flagged trips | Whether dispatch changed a plan before release |
| Pre-shift interventions completed | Early | Completed check-ins, break plans, or task changes ÷ flagged drivers | Whether supervisors followed the response plan |
| Fatigue-linked telematics events | Outcome | Tagged events per 10,000 miles | Road behavior tied to fatigue exposure |
| Near misses | Outcome | Near misses by terminal, route, or duty window | Residual safety exposure after controls |
| Coaching burden | Outcome | Coaching cases or review hours per 100 drivers | Supervisor time spent on video review and follow-up |
| Route disruption | Outcome | Delays, reassignment, or missed service tied to fatigue controls | Service and dispatch impact |
Read these numbers as a chain, not as stand-alone totals. Stable exposure with fewer harsh braking events, fewer late-shift lane deviations, and lower coaching hours points to better control; rising exposure with weak supervisor follow-through points to threshold issues, schedule strain, or poor process fit.
Fleet-wide averages hide where risk concentrates. Break results out by operating segment so the effect of driver fatigue management stays visible:
Readi gives operations teams and supervisors on-demand visibility into fatigue risk and performance. That view supports resource allocation, task planning, worker training, and schedule decisions; it also gives AI in fleet management a practical role by pulling signals from multiple systems into a format leaders can review without long manual analysis.
Program accuracy shifts as the fleet changes. A model that fit spring routes may lose precision in peak season when night volume rises, detention grows, customer windows tighten, or a new driver mix enters the network.
Set a review cycle that matches the pace of change in the operation. A dedicated fleet with fixed lanes may need a monthly check; a network with surge freight, slip-seat use, or frequent route resets may need a shorter interval so risk flags stay tied to real driver fatigue management needs.
Keep expansion disciplined. A pilot should move to broader use only after response steps, role ownership, and report use stay stable across several operating cycles; fleets that scale too early often create uneven supervisor habits and low trust in the system.
Tools such as Readi support this stage well because supervisors can view fatigue risk and workforce performance on demand, while management can use the same output for resource allocation, task planning, worker training, and scheduling. In operations that need earlier notice, Readi can forecast fatigue risk 18 hours in advance.
The strongest systems in 2026 combine biomathematical fatigue models with operational data from dispatch, route timing, prior rest opportunity, and duty patterns. Many fleets also add in-cab infrared monitoring that tracks PERCLOS, head position, and gaze behavior, then pair that stream with cloud dashboards for supervisor review.
Current technology patterns include:
Predictive analytics in transportation cuts exposure by changing decisions before the highest-risk miles begin. A fleet can shift a driver away from a night run after poor rest, move a time-sensitive load to a lower-risk operator, or plan a controlled stop before performance drops during a circadian low.
This approach also helps fleets separate a fatigue from misconduct. A harsh stop at 4:30 a.m. after an irregular start pattern may point to degraded alertness, not a simple coaching problem. That distinction improves driver fatigue management because supervisors can match the response to the cause, whether the answer is schedule repair, task reassignment, or targeted training.
A mature program gives managers a clearer view of who needs support, which routes create the most strain, and where schedule design adds avoidable risk. That makes fatigue risk management systems useful for both transportation safety and daily operating control.
The most practical benefits show up in routine decisions:
Integration works best when the fatigue signal appears inside systems that dispatchers and front-line leaders already use each day. That usually means route planning screens, pre-assignment reviews, supervisor exception queues, and post-trip safety review tools.
Readi supports that model with on-demand visibility into workforce fatigue risk and performance for operations teams and supervisors. It also informs decisions on resource allocation, task planning, worker training, and scheduling, which makes it easier to place fatigue insight inside normal workflow rather than in a separate program that teams ignore.
Transportation safety trends 2026 point toward consolidation. Fleets want one operating picture across safety, scheduling, maintenance, and utilization because disconnected systems slow decisions and hide patterns that stretch across departments.
Another clear shift involves prediction quality. Fleet leaders place more value on tools that help staff synthesize information from multiple systems, avoid false starts, and make cleaner forecasts about risk, staffing, and route exposure. In practice, that means broader use of predictive scheduling, stronger links between wellbeing and safety data, and more interest in fatigue controls that fit commercial operations without extra hardware.
Fleets that treat fatigue as a scheduling and dispatch problem, not just a compliance checkbox, tend to see stronger returns from every safety tool in the stack. The programs that hold up over time share a few common traits:
Readi forecasts fatigue risk up in advance, requires no wearables or hardware, and has been proven to reduce fatigue-linked in-cab telematics events by 42% in a large U.S. logistics pilot. That forecast window gives supervisors enough lead time to adjust assignments, plan breaks, or reassign routes before reduced alertness reaches the road.
Book a demo to explore how Fatigue Science's predictive fatigue management software can improve safety and productivity.