
Product News

When we hosted The Future of Fleet Safety and Its Impact on Operational Efficiency for the NAFMP Solutions Series, the audience sent in 47 questions. We expected questions about technology. We got those, but the sharper ones were about trust: who sees the score, what happens to a driver who gets flagged, and what to do when the ELD says a driver is legal but the data says he is tired.
Those questions get to the real issue. Most fleets do not have a visibility problem anymore. Cameras and telematics show exactly what happened. What fleets lack is a way to act before it happens, without turning safety into surveillance.
Below, Tomas Kuras (VP of Revenue) and Marco Parlato (Director of Product Management) answer the questions we can speak to with evidence: from our predictive fatigue platform, Readi, and from a controlled pilot at a large U.S. logistics fleet where the drivers using Readi had 42% fewer fatigue-linked in-cab telematics events than a matched control group.
Where a question belongs to a physician, regulator or lawyer, we have left it for them.
Yes, AI cameras help, and they answer a different question than prediction does. Fatigue technology falls into three groups by when it acts:
|
Approach |
Question it answers |
When it acts |
|---|---|---|
|
Hours-of-service compliance (ELD) |
Were we legal? |
Across the duty week |
|
Detection: in-cab cameras, telematics, AI vision |
What is happening right now? |
During the drive, once signs appear |
|
Prediction: biomathematical fatigue forecasting |
What is about to happen? |
Before the shift starts |
In-cab cameras detect head nods, eye closure and lane drift. That is valuable, but by the time those signs show, the driver is already impaired at highway speed. A 2–4 second microsleep at 65 mph covers roughly 190–380 feet with no one in control.
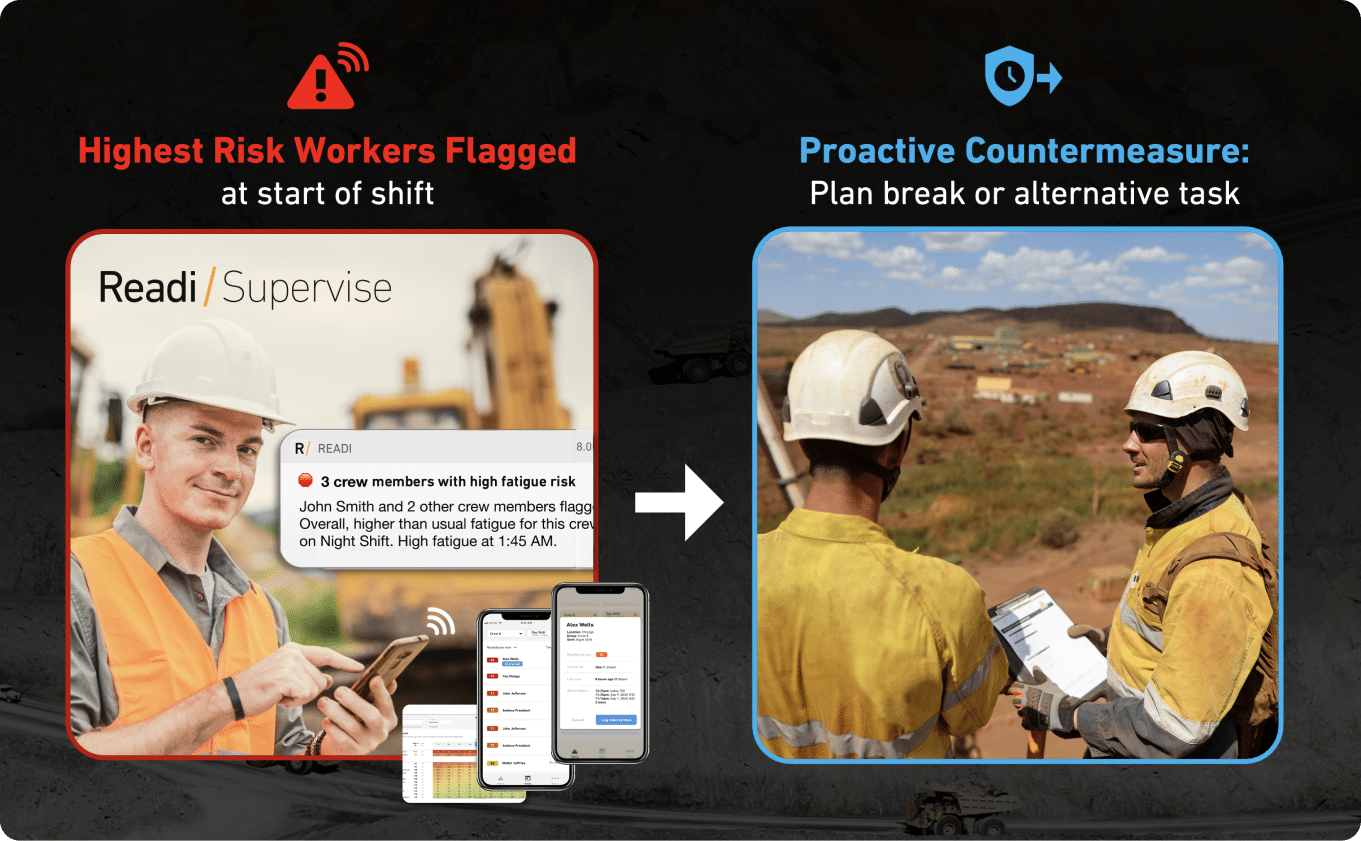
Prediction moves the intervention point upstream. Readi gives dispatchers an hour-by-hour fatigue forecast for each driver's full upcoming shift, so they can act before the engine starts. It is designed to work alongside cameras, not replace them: prediction is the first line, the camera is the last line.
There is no watch required. Readi does not depend on wearables or new hardware. It estimates each driver's sleep from work and rest patterns already in your systems, then runs that through the SAFTE™ biomathematical model to forecast alertness across the shift.
That was a deliberate design choice. Wearables create rollout cost, charging and compliance problems, and privacy concerns that slow adoption.
In our logistics pilot, fatigue forecasts were generated from existing ELD data, with no wearables and no new hardware. That is the setup that produced the 42% result.
The inputs are:
From there, our SleepML model estimates when and how much each driver likely slept. SAFTE™, a model developed for the U.S. Army and used in DOT and FAA research, turns that sleep history into an hour-by-hour alertness forecast.
Each driver gets a personalized sleep profile. Readi matches individual work and rest patterns against a database of more than 10 million anonymized sleep records, then refines the profile as the driver's own history builds.
The forecast reflects that driver's recent sleep pattern, typically the prior ~10 days, not a fleet average. Two drivers on the same route and the same shift can get very different forecasts.
Yes. Readi pulls duty-status data automatically from existing ELD platforms such as Geotab, Motive and Samsara. There is no manual entry and no new login for drivers.
The pairing matters. HOS data tells you how long someone has been on duty. Readi adds when they are likely to be at risk within the shift.
The principles apply to any fleet: sleep opportunity and time of day drive fatigue regardless of fleet size. The software delivers the most value where there is a dispatcher or supervisor who can act on a forecast, such as adjusting a route, moving a break or having a check-in conversation.
Our deployments today skew toward mid-size and large fleets with dispatch teams and dynamic schedules. Smaller carriers can start with the countermeasure side: build a non-punitive fatigue reporting culture and plan schedules around circadian low points.
We cannot speak to the false-positive rates of other devices on the market. We can tell you how ours is validated and what that means in practice.
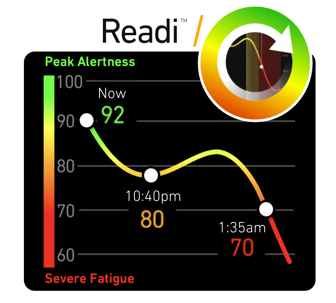
One framing note: Readi is not a pass/fail test at the check-in window. It forecasts risk across every hour of the shift, so a dispatcher sees when risk will peak, not just a yes/no at departure. That changes the response from "pull the driver" to "plan the break before 3 a.m."
Because the forecast is built from sleep history and time of day, not from how someone looks or performs at check-in, grogginess in the first minutes after waking does not drive the score. A driver who slept well and starts a daytime shift forecasts as low risk even if he is still on his first coffee.
This is a real weakness of point-in-time tests: they measure a moment, and the moment right after waking is a bad one to measure.
Readi works from schedule and duty-status data plus a one-time sleep questionnaire. There are no cameras, no biometrics and no in-cab monitoring. Supervisors see a fatigue forecast so they can act; they do not see how a driver spends their time off duty. No one in the organization can see an individual’s sleep hours.
We would encourage any carrier to ask every safety vendor the same question: what data leaves the cab, who can see it and what it can be used for.
This was the most important design question in the pilot, and the answer is part policy and part product.
In the pilot, well. Supervisors acted on 1,722 high-risk shifts before departure, and countermeasure utilization reached up to 81%. One supervisor summed up driver feedback at the debrief: drivers liked that the company was looking out for their safety, not just grading how they drive.
Acceptance comes down to what the tool asks of drivers. Readi asks almost nothing: no device to wear, no app to open every shift, no camera pointed at them.
Stop treating fatigue as something a driver admits to and start treating it as something the operation forecasts. When the schedule, not the driver, is the source of the flag, reporting stops being a confession.
In practice that means three shifts:
As a leading indicator alongside the lagging ones you already track. Most SMS dashboards are built on events, citations and claims, all of which describe what already happened. A fatigue forecast adds the one input that arrives before the shift.
It also adds documentation. Every forecast and every countermeasure is time-stamped, which gives you an auditable record showing the fleet identified risk and acted on it.
Both, because they measure different things. HOS caps hours on duty. It cannot see whether a driver slept four hours or eight before a legal shift, or whether that shift crosses the 2–6 a.m. circadian low.
A legal driver can be a fatigued driver. The practical answer is to treat HOS as the floor and the fatigue forecast as the trigger for a conversation: check in with the driver, move a break into the forecast risk window, or adjust the route.
That threshold is a company policy decision, and it should be written down before you roll out any tool. In our experience, standing a driver down should be the rare end of a ladder, not the default response:
Because Readi forecasts the whole shift, most interventions can happen early and lightly. Pairing the forecast with the driver's self-report keeps the decision human.
Track a short set, weekly:
The last point is how you prove the barrier works. In our pilot, the Readi group's in-cab events per driving hour fell 15% while a matched control group's rose 27% over the same period, a 42% gap.
Four things made the difference:
No technology replaces the conversation between a supervisor and a driver. The best it can do is make that conversation earlier and better informed.
HOS rules regulate quantity: how many hours a driver may be on duty and how much rest separates shifts. Fatigue depends just as much on timing. An 11-hour shift starting at 6 a.m. and one starting at 10 p.m. are equally legal, but they carry very different risk, because the second runs straight through the body's 2–6 a.m. low point.
Rules have to be simple enough to enforce across millions of drivers, so they cannot be personalized. That is the gap a fatigue forecast fills: it applies circadian timing and each driver's recent sleep to a schedule that is already legal.
Considerably. Alertness declines with time awake, and the decline is not linear: it compounds once wakefulness runs past the normal day, and it compounds again when the extended period crosses the overnight low. Sleep debt from the days before adds to it.
This is also why risk can climb during peak season even when every driver stays within HOS limits. In our pilot, the control group's fatigue-linked events rose 27% through a demanding peak period.
Hours driving is only one part of it. The bigger driver is hours awake. Two hours waiting at a dock still count toward time awake and still erode alertness, even though no miles move. A driver who waits through the afternoon and then drives into the evening may start the drive already well into a fatigue curve.
That is one reason detention time deserves a place in fatigue conversations, not only in billing ones.
We will leave the regulatory question to regulators. From a fatigue-science standpoint, the effect depends on what the hour enables. If it lets a driver get to a place where they will sleep better, it can improve the next shift. If it extends a shift that is already running into the circadian low, it adds risk at the worst possible time. The answer is driver- and time-specific, which is what a forecast is built to show.
Fatigue degrades the skills safe driving depends on before a driver ever nods off:
This is why fatigue shows up in your camera and telematics data long before it shows up in a crash report. At a ReadiScore below 70, harsh braking runs 8.5× higher than for alert drivers.
The one we hear most: "I can push through it." You cannot postpone fatigue. Caffeine, cold air and loud music mask the feeling briefly; they do not repay sleep debt. The only fix is sleep.
Other common myths:
What works best when explaining fatigue science to drivers is making it personal and non-judgmental. Show drivers their own forecast pattern, talk about fatigue as physiology rather than performance, and let supervisors open the conversation with "How did you sleep?" rather than "Why were you braking hard?"
Against a matched control group, using event data the fleet already trusted. The design is what makes the result defensible:
|
Element |
Detail |
|---|---|
|
Fleet |
Large U.S. logistics fleet, high-volume feeder operations |
|
Readi group |
95 drivers |
|
Control group |
85 matched drivers ("twins"), paired on route type, schedule and tenure |
|
Conditions |
Same operating period and geography, including peak-season pressure |
|
Inputs |
Existing ELD data only; no wearables, no new hardware |
|
Metric |
Fatigue-linked in-cab telematics events per driving hour |
|
Analysis |
Performed independently by the fleet's existing video telematics provider |
The result: events per driving hour fell 15% in the Readi group and rose 27% in the control group over the same window, a 42% difference. The categories that dropped were the ones camera programs already work to reduce: harsh braking and acceleration, forward collision risk and lane drifting.
The pilot also had operational success criteria that mattered as much as the number: forecasts generated for every participant, a working ELD integration, countermeasures approved company-wide, and positive driver and dispatcher feedback.
The lesson for any fleet evaluating a safety technology: insist on a control group and measure with data you already collect. Otherwise seasonal swings can make any tool look good, or bad.
Read the 47 questions together and one theme stands out. Fleets are not short on data about what went wrong. They are short on a way to act before it does, in a form drivers will accept.
Three takeaways from the session:
Want to see what this looks like for your fleet? Ask for a 15-minute sample forecast walkthrough: an hour-by-hour fatigue forecast across a real shift, in a fleet like yours. Or ask us for the pilot detail: methodology, twin-group analysis and operational findings. [Link: fatiguescience.com]
Missed the live session? Watch the on-demand recording