
Product News


Fleet insurance costs are shaped by risk. The more frequently a fleet experiences collisions, claims, unsafe driving events, or operational breakdowns, the harder it becomes to control premiums and renewal terms.
Telematics can help by giving fleet managers a much clearer picture of how their vehicles and drivers are performing. Instead of relying only on historical claims or general industry benchmarks, fleets can use real operating data to show insurers how much exposure they have, where risk is occurring, and whether safety performance is improving.
That information can include mileage, speeding, harsh braking, vehicle use, maintenance activity, driving hours, and preventable incident trends.
The strongest results come when fleets use that data to improve day-to-day safety. Driver coaching, supervisor follow-up, maintenance controls, and documented corrective action all matter.
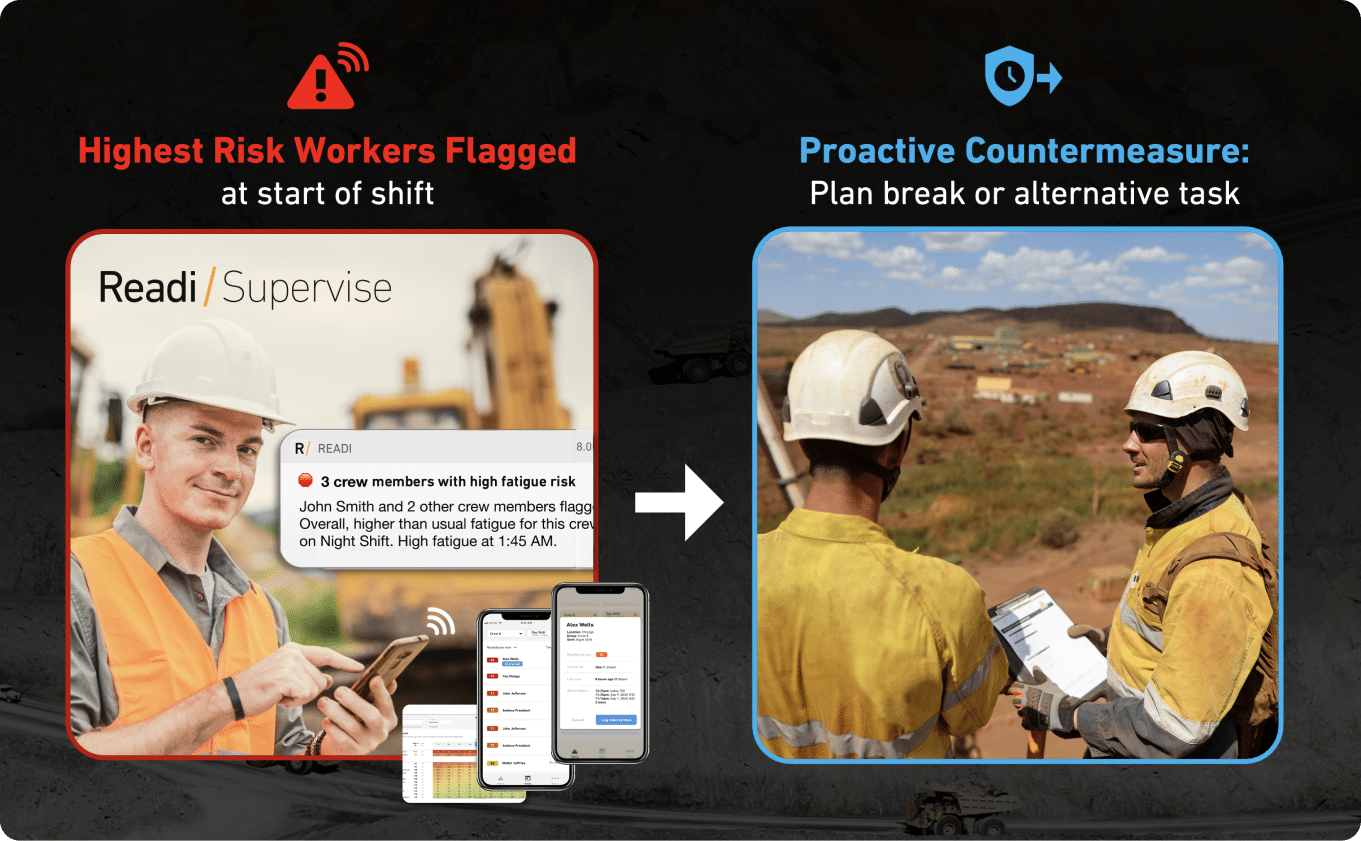
For fleets operating overnight or across irregular schedules, fatigue is another important part of the picture. Telematics can identify risky driving events, while predictive fatigue technology such as Readi can help identify when a driver's fatigue risk is likely to increase before those events occur.
Together, these tools can give safety teams and insurers a more complete view of fleet risk.
Telematics can help lower fleet insurance costs by giving insurers more reliable evidence of how a fleet operates.
An underwriter may look at a fleet's claims history, vehicle types, operating territory, mileage, driver profile, and other factors when assessing risk. Telematics adds more detail by showing what is happening between claims.
That can include:
The value of this information increases when a fleet can show that safety risks are being managed consistently.
A fleet that identifies repeat speeding, coaches the driver, documents the intervention, and shows a reduction in repeat events has a stronger underwriting story than a fleet that only collects the speeding data.
Before approaching an insurer or broker with a telematics story, establish a reliable baseline.
The goal is to show how the fleet is performing over time and how that performance is changing.
Useful baseline data may include:
Whenever possible, normalize safety events by exposure.
For example, raw event counts can be misleading if one group of drivers travels significantly more miles than another. Metrics such as events per 1,000 miles or incidents per million miles create a more useful comparison.
Organized telematics data can also help underwriters understand the difference between a fleet's actual operating conditions and a broad industry average.
For transportation and industrial fleets, it may also help to separate highway driving, yard activity, private-site operation, and remote-road exposure.
Those environments carry different types of risk and should not always be grouped together.
Telematics platforms can produce a large number of metrics, but only some of them are likely to matter in an insurance discussion.
Fleet managers should focus on measures that relate directly to exposure, unsafe driving, collision potential, and claims.
Common examples include:
The trend over time is often more useful than a single driver score or one month of results.
For example, if speeding events have declined consistently over four quarters after a coaching program was introduced, that shows a working safety process.
That type of improvement is more meaningful than simply showing that the fleet has telematics installed.
Driver behavior monitoring is one of the most practical ways telematics can support insurance cost reduction.
The basic process is straightforward:
This process can be used for speeding, harsh braking, distraction, aggressive acceleration, unsafe following distance, and other behaviors.
The important part is follow-up.
A completed coaching session does not automatically mean the risk has been reduced. Safety teams should look at what happens after the conversation.
If the driver improves, the program is working.
If the same event continues to appear, the fleet may need to review the coaching approach, route conditions, workload, schedule, or another contributing factor.
Efforts to reduce insurance costs are more likely to produce lasting value when driver behavior actually changes.
Telematics is very good at showing what drivers and vehicles are doing.
It is less suited to identifying why a driver may become more vulnerable to risk later in a shift.
Fatigue is one area where that matters.
A driver may remain compliant with Hours of Service rules and still experience elevated fatigue because of poor sleep opportunity, schedule changes, overnight driving, circadian timing, or accumulated sleep loss.
Fatigue can affect reaction time, cognitive effectiveness, and lapse likelihood. Readi uses the validated SAFTE™ biomathematical fatigue model to estimate these effects on an hour-by-hour basis.
For transportation fleets, Readi can use ELD and schedule data as inputs to personalized fatigue predictions. Wearables are optional, which allows fleets to add fatigue risk information without requiring every driver to use a device.
This can help safety teams understand patterns that telematics alone may not explain.
For example, a fleet may notice that harsh braking events increase during certain overnight windows or after schedule changes. Looking at fatigue risk alongside the telematics record may help determine whether the issue is related to driver behavior, operating conditions, fatigue, or a combination of factors.
That information can support a stronger safety program and a more detailed underwriting discussion.
Insurers may care about event frequency, but they may also want to understand how the fleet responds when problems appear.
A strong safety program leaves a record.
Useful documentation can include:
The goal is to show that telematics information leads to a consistent response.
For example, two fleets may record the same number of speeding events. One may simply store the events in its system. The other may identify the highest-risk drivers, coach them, track repeat violations, and show that event rates declined over the following months.
Those fleets may appear very different to an underwriter.
For regulated commercial fleets, this type of documentation can also support a broader compliance and safety narrative.
Fleet insurance costs are affected by both claim frequency and claim severity.
Telematics can help when an incident has already occurred by providing objective information about what happened.
That may include:
This information can support accident investigations and claims review.
It can also help defend a driver when the available data shows that the fleet vehicle was not responsible for the incident.
Better evidence may help shorten investigations, reduce uncertainty, and improve the quality of the information provided to insurers, brokers, legal teams, and claims handlers.
For fleets dealing with rising repair, legal, and liability costs, this can be an important part of the value of telematics.
Insurance risk is not limited to driver behavior.
Vehicle condition and vehicle use also matter.
Telematics can help fleets monitor:
A fleet that can demonstrate consistent maintenance and better control over vehicle use may be able to show a stronger overall risk profile.
This is especially relevant for fleets that operate in remote or mixed-duty environments.
Transportation fleets may move between public roads, yards, private sites, and remote areas. Vehicles may also operate at night or across long shifts.
In those environments, combining maintenance, vehicle tracking, driver behavior, and fatigue information can help safety teams understand risk more accurately.
Fleet managers should not assume that an underwriter will automatically see the value of a telematics program.
The renewal package should explain the results clearly.
Useful information may include:
Fleets may also include information showing how they are managing risk before an event occurs.
Examples include:
This gives brokers and underwriters a clearer picture of how the safety program operates in practice.
Telematics can support lower premiums or better insurance terms, but the outcome depends on the fleet and the insurer.
Factors that may influence the result include:
Some fleets may receive discounts or more favorable terms. Others may see more value through fewer claims, better claims handling, or more stable renewals.
For that reason, telematics ROI should be evaluated across the full insurance picture rather than premium savings alone.
Telematics, cameras, and ELDs already provide valuable information about driver and vehicle activity.
Readi adds another type of information by helping fleets understand when fatigue risk is likely to increase during an upcoming shift.
Readi generates personalized fatigue predictions using the SAFTE™ biomathematical fatigue model. In transportation applications, it can use ELD and schedule information to support predictions without requiring a wearable for every driver.
This can give dispatchers and safety teams more time to respond to elevated fatigue risk.
Depending on your fleet fatigue management policy, that could include reviewing an assignment, adjusting break timing, changing a route, or increasing supervisor attention during a higher-risk period.
Readi fleet fatigue management technology is designed to work alongside telematics and camera systems. The systems provide different types of information, and together they can give fleets a broader view of safety performance.
For insurance discussions, that can help show that the fleet is using both historical safety data and forward-looking risk information as part of its safety program.
Telematics gives insurers more detailed information about how a fleet is operating.
Data such as mileage, speeding, harsh braking, driver behavior, vehicle use, maintenance, and incident trends can help underwriters evaluate a fleet's actual risk more closely.
When the data shows sustained improvement and strong safety controls, it may support better rates or policy terms.
The exact metrics vary by insurer, but common examples include:
Yes, when the fleet uses the data consistently.
Telematics can help identify risky driving, support driver coaching, improve maintenance, and track whether safety performance is improving.
Passive monitoring is less likely to produce the same result.
There is no standard percentage.
Savings depend on the fleet, insurer, coverage, claims history, geography, and safety performance.
The financial value may include lower premiums, better renewal terms, fewer claims, lower claim severity, and better defense of drivers who are not at fault.
Yes.
Telematics can provide information such as speed, location, braking, route history, and event timing.
When connected with camera footage, it can provide additional evidence during an incident investigation.
That may help insurers and fleet managers determine what happened more quickly.
Fatigue management can help fleets address a risk factor that may contribute to unsafe driving.
Readi provides personalized fatigue predictions for upcoming shifts and can use operating information such as ELD and schedule data.
This information can be reviewed alongside telematics data to help identify higher-risk periods and support earlier safety interventions.
There can be.
Common challenges include:
Clear policies and consistent management are important.
Drivers should understand what information is being collected, how it will be used, and how coaching decisions are made.
Telematics gives fleets a much better record of what happens on the road.
The real insurance value comes from using that information to improve safety performance over time.
That means identifying risky patterns, coaching drivers, maintaining vehicles, documenting corrective action, reviewing claims, and showing insurers that those efforts are producing measurable results.
Adding fatigue information can strengthen that approach for fleets with night work, irregular schedules, or long operating hours.
Readi helps fleets predict fatigue before shift start and throughout the shift ahead. It can work with ELD and schedule data and can be deployed without requiring wearables for every driver.
Used alongside telematics and camera systems, it gives fleet managers another way to identify risk earlier and act before it contributes to an incident.
For insurers, that can support a stronger underwriting conversation. For fleet operators, the bigger benefit is a safer operation with fewer preventable losses.