
Product News


Driver behavior analytics is the practice of collecting and analyzing vehicle, sensor, and operational data to monitor how drivers perform, identify risky patterns, and guide interventions that improve fleet safety and efficiency. It brings together telematics data analysis, driver behavior scoring, and safety performance indicators to help fleet leaders move from raw data to informed action.
Most fleets today generate large volumes of behavioral driving data through GPS units, accelerometers, dashcams, ELDs, and vehicle tracking systems. The challenge is rarely a lack of data. The challenge is turning that data into timely decisions that reduce risk before an incident occurs.
Driver behavior analytics addresses this gap by organizing driver performance metrics into structured workflows. Safety teams can use these workflows to prioritize driver coaching programs, flag high-risk patterns, and track improvements over time. Common metrics include harsh braking frequency, rapid acceleration events, speeding, cornering severity, idling time, and seatbelt compliance.
The most effective fleet safety technology programs layer multiple data sources together for a fuller picture of driver risk assessment. A telematics alert for harsh braking, for example, becomes more meaningful when paired with time-of-day data, hours driven, and route conditions. Predictive analytics in driving takes this a step further by forecasting elevated risk before it shows up on the road. Tools like Readi apply biomathematical fatigue modeling to ELD data and can forecast fatigue risk up to 18 hours in advance, giving dispatchers and safety managers an earlier signal than reactive alerts alone.
This guide covers the core components of a driver behavior analytics program:
Each section is written for safety directors, fleet managers, and operations leaders responsible for reducing fatigue-related incidents, controlling costs, and strengthening their overall safety programs.
Research on real-world driving has shown that driver inattention plays a role in more than 75% of crashes and about 65% of near-crashes. Fatigue, drowsiness, and reduced vigilance often show up first as unstable speed control, late response to traffic, and poor lane discipline before a collision, claim, or camera review puts a label on the event.
An ELD can confirm legal drive time. A supervisor can note who looks tired at dispatch. Neither source can show how a driver actually performed on the second overnight run of the week, after short sleep, in poor weather, on a familiar route. Driver behavior analytics fills that blind spot by pulling signals from vehicle tracking systems, event history, and in-cab evidence into a usable picture of exposure across drivers, routes, and shift windows.
That shift gives safety leaders more than a stack of alerts. It shows whether a single event came from traffic conditions or whether a repeat pattern points to a larger issue tied to schedule design, time of day, or declining alertness. For fleets with linehaul, night delivery, or long-duty operations, that difference has direct value because a late intervention often follows property damage, public exposure, or lost freight.
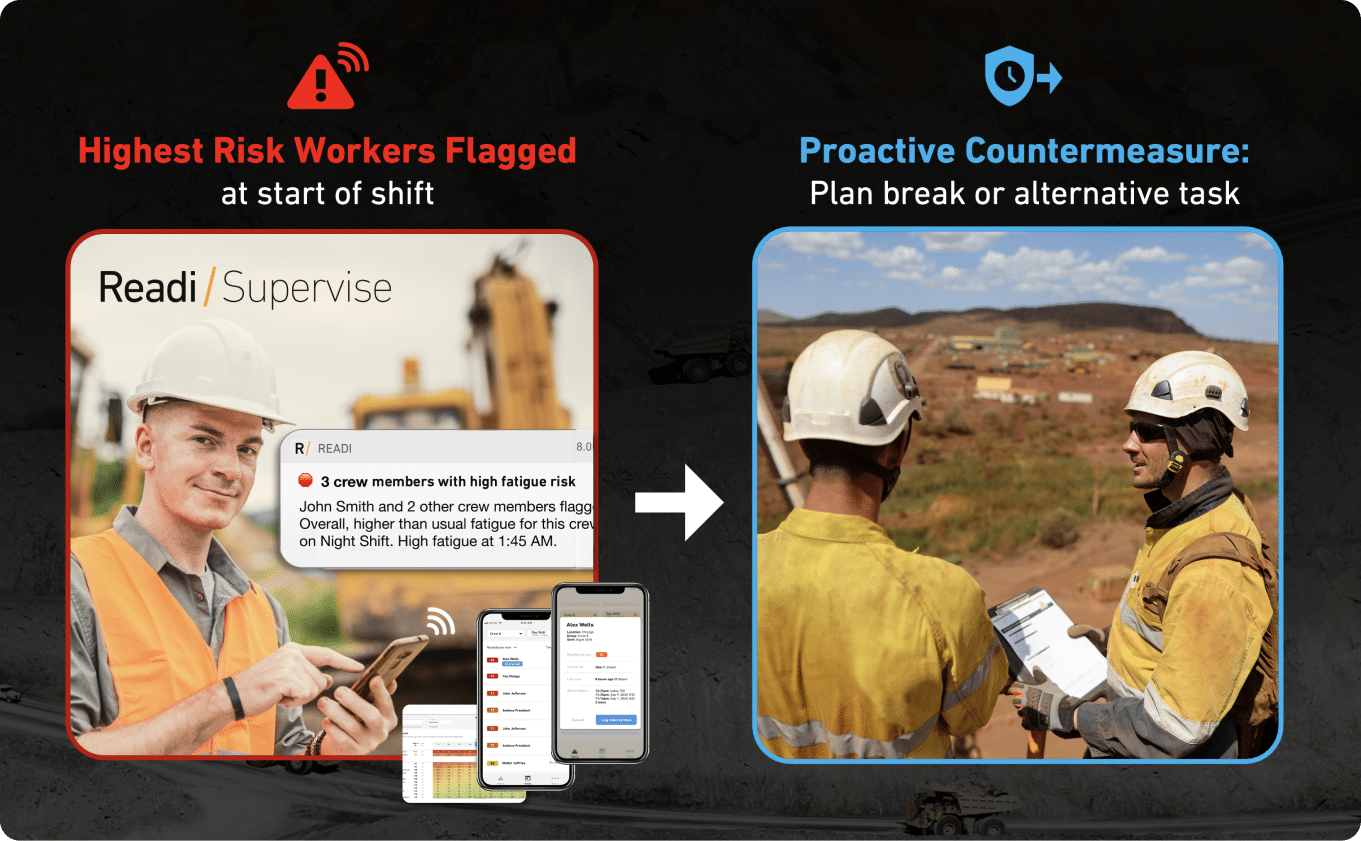
The picture becomes more complete when fleets place fatigue data beside on-road behavior. A cluster of braking and spacing problems during early-morning hours carries different meaning when the driver also shows elevated sleep-related risk. That is where predictive analytics in driving becomes useful at the operational level. Readi gives supervisors on-demand visibility into fatigue risk and performance so they can make better decisions about scheduling, task assignment, and intervention before the next run.
Once a fleet identifies broad risk patterns, the next step is to isolate which event types break down first under real operating pressure. In commercial trucking, the clearest trip-level signals usually come from brake-force spikes, throttle surges, excessive corner force, and posted-speed violations.
These records sit at the center of many driver performance metrics because they are easy to count and compare across drivers, routes, and terminals. They also remain lagging indicators within driver behavior analytics; the unsafe maneuver has already taken place by the time the system logs it. In heavy-duty fleets, each severe brake event also creates a cost chain: loss of momentum, extra fuel use, more brake wear, and added strain on tires and suspension.
Most fleet tracking platforms turn event history into a weighted score over a set time period, often by day, week, or month. A driver behavior scoring model helps supervisors sort large groups fast, spot unusual patterns, and direct driver coaching programs toward the cases with the highest event density or severity.
The weakness appears when the score treats every event as a simple behavior problem. Two drivers can post similar totals for very different reasons; one may have poor following distance habits, while another may work through cumulative sleep debt, circadian disruption, or a badly structured night rotation. A score without context can rank risk, but it cannot explain cause.
Fatigue often leaves a distinct signature in behavioral driving data. Safety teams tend to see more abrupt speed correction, later braking responses, lane control drift, and inconsistent pacing during biologically low periods such as post-midnight hours, pre-dawn starts, and extended duty windows.
A stronger driver risk assessment looks upstream from the event itself. When fleets compare safety event clusters with duty records, dispatch timing, and fatigue forecasts, root causes become easier to separate. Readi adds that context with fatigue forecasts 18 hours in advance, which gives supervisors a practical basis for schedule changes, route reassignment, or rest decisions before the next set of alerts appears.
Telematics gives fleet teams a trip-by-trip record of how a vehicle moved, where risk concentrated, and which operating conditions surrounded an event. Instead of a single alert, supervisors can review speed changes, throttle inputs, brake pressure, engine status, and route history in sequence; that level of detail supports stronger driver risk assessment and more accurate review of behavioral driving data.
In-cab systems add evidence that numbers alone cannot supply. A harsh brake event may look identical in a dashboard, but video can show whether the cause was phone use, eyes off the road, late hazard response, lane drift, or a cut-in from another vehicle. That visual layer improves driver behavior scoring because it reduces guesswork and gives driver coaching programs a clearer basis for action.
| System | Primary output | Operational use | Blind spot |
|---|---|---|---|
| Telematics platform | Route history, speed variance, motion events, engine data | Trend review, event classification, trip replay | Cannot confirm driver state inside the cab |
| In-cab camera | Road-facing and driver-facing footage | Event validation, near-miss review, distraction review | Only captures what happened after exposure appeared |
| ELD | Duty status, breaks, available drive time | Hours-of-service checks, dispatch review, audit support | Legal hours do not show actual alertness |
| Readi | Fatigue forecast from sleep and schedule patterns | Pre-dispatch review, task assignment, supervisor planning | Depends on use inside daily operating routines |
ELDs remain important because they show duty transitions, break timing, and available hours, yet they stop at compliance. A driver can sit within legal limits and still carry sleep debt or circadian disruption. For fleets that already invest in cameras, ELDs, and fit-for-duty processes, Readi adds a forward view of fatigue exposure before a run begins; that gives dispatch and safety staff more room to adjust route timing, task mix, or rest plans before telematics events stack up.
Many fleets still run driver behavior analytics through a post-event loop: the platform captures a speeding exception or near-miss clip, a supervisor opens the trip record, then a coaching note follows after the run ends. In a large operation, that sequence can create a backlog of alerts, duplicate exceptions, and video segments that offer little value. By the time staff sort signal from noise, the driver has already passed through the period of highest exposure.
A post-trip record shows what took place in the cab and on the road. It does not show whether the driver started work after reduced sleep, a night rotation, or a short recovery window between duty periods. Those conditions affect alertness well before a camera captures distraction or a telematics platform logs unstable speed control. A forward-looking model uses sleep and schedule history to flag the small share of shifts with the highest fatigue exposure, which gives dispatch and safety teams time to adjust the plan before release.
| Program element | Reactive model | Predictive model |
|---|---|---|
| Decision point | After event review | During pre-dispatch planning |
| Main inputs | Video clips, trip exceptions, HOS records | Sleep history, schedule design, duty timing, route demands |
| Supervisor task | Sort alerts, classify events, document follow-up | Prioritize the highest-risk assignments and change the plan |
| Operational effect | Heavy review load; action after exposure | Smaller exception queue; fewer downstream safety events |
Readi supports this operating model with on-demand visibility into fatigue risk and workforce performance. It informs resource allocation, task planning, worker training, and scheduling without new hardware, which helps supervisors focus on the few assignments that need intervention instead of working through every alert.
Coaching works best when supervisors can identify the condition behind the behavior. A close-following pattern, late braking, or unstable speed control may look like a training problem on the surface, yet the actual source may sit in sleep loss, night work, or a rotation that cuts into recovery time. A review that ignores that context often leads to repeat conversations with little change in road performance.
A fleet that pairs schedule and sleep information with on-road event history can sort cases with more precision. The same unsafe pattern can require a different response based on timing, route demand, and recent rest opportunity. That sharper view helps a safety lead decide whether the next step should be instruction, accountability, or fatigue mitigation.
That distinction changes the tone of the conversation. Drivers tend to trust reviews that reflect actual operating conditions instead of a narrow review of clips, scores, or isolated alerts. Supervisors also use their time better because they can focus one-on-one discussions on the cases with the highest potential for change.
Readi supports that process with on-demand visibility into workforce fatigue risk and performance, which helps supervisors make better decisions about task planning, training, resource allocation, and scheduling. It also provides fatigue forecasts 18 hours in advance, which gives operations teams time to adjust assignments or departure plans before a high-risk work period.
Fleets can then test whether lower fatigue exposure leads to fewer unsafe road events across the same routes, terminals, or driver groups. That link gives coaching teams a way to judge program effectiveness with more than incident counts alone, and it helps them show whether schedule changes, rest planning, or fatigue controls produce measurable improvement.
A useful program starts with operating rules, not another dashboard. Safety leaders need a clear path from signal to action: which risk enters review first, who owns the response, and which driver performance metrics show whether the response worked.
Most fleets already store the pieces of a solid driver risk assessment, but those pieces often sit under different team owners and different clocks. Telematics may sit with operations, ELD records with compliance, and camera review with safety; until those records share a driver ID, vehicle ID, and trip timestamp, behavioral driving data stays fragmented and hard to use.
The first build step is basic normalization. Match event records to the same trip record, map drivers across systems, and pull those fields into one workflow so a supervisor can review route context, duty status, and driver behavior scoring in one place. Readi adds a fatigue layer to that same view and gives operations teams on-demand visibility that supports task planning, resource allocation, training decisions, and schedule review.
A prevention model needs upstream signals that appear before a camera clip or telematics alert. Fleets with night runs, rotating duty cycles, or tight turnarounds should rank sleep opportunity, recent duty pattern, and time-of-day exposure alongside traditional safety performance indicators such as speeding and hard braking.
Predictive analytics in driving becomes more practical once fatigue exposure enters the queue before dispatch. Readi can surface elevated fatigue risk 18 hours in advance, which gives supervisors time to focus on a narrow exception list instead of a broad alert stream. That shift cuts noise in the review process and points attention to the trips with the highest chance of unstable speed control, poor spacing, or late-shift error.
Driver behavior analytics only changes outcomes when it sits inside daily operating routines. High-risk flags should appear where dispatchers and frontline leaders already approve loads, assign routes, and review exceptions, with response options tied to each alert type.
That workflow should include specific actions rather than open-ended review. A fatigue-related flag may trigger a later departure, a route swap, a planned rest stop, or a direct check-in before release; a repeated harsh-cornering pattern may trigger route-specific coaching or a vehicle review. The value comes from faster decisions with better context, not from larger report volumes.
Use a short scorecard that ties fleet safety technology to business results:
Driver behavior analytics is a fleet management discipline that converts trip data into usable safety decisions. In practice, it produces driver scorecards, exception reports, risk rankings, and trend views that show where unsafe patterns sit across drivers, routes, vehicles, and duty periods.
Naturalistic driving research has linked driver inattention to more than 75% of crashes and 65% of near-crashes. Driver behavior analytics helps safety teams isolate the habits and operating conditions behind those outcomes, which supports faster intervention on recurring exposure such as nighttime route risk, distracted driving, or unstable performance late in a duty window.
Most fleets track a mix of event data, exposure data, and efficiency data. Common examples include:
Telematics systems supply the time-stamped trip record that anchors driver risk assessment. They show where an event happened, how the vehicle responded, and what part of the trip carried the highest exposure, which gives supervisors far more context than a stand-alone alert or a single video clip.
A mature program gives fleets better control over coaching workload, fuel waste, vehicle wear, and claim exposure. It also improves resource planning because managers can see which terminals, lanes, or schedules produce the most preventable risk instead of relying on anecdotal reports or end-of-month summaries.
For fleets with existing cameras, ELDs, and fit-for-duty processes, Readi adds another operational input: fatigue visibility 18 hours in advance. That forecast supports scheduling, task assignment, and worker training decisions with less guesswork and better use of supervisor time.
The fleets that get the most from driver behavior analytics are the ones that connect their data sources into a single decision point for supervisors. Cameras, telematics, ELDs, and fatigue forecasts each answer a different question. When those answers reach the right person before dispatch, the program shifts from documenting risk to preventing it.
Readi forecasts fatigue risk up to 18 hours in advance, requires no wearables or hardware, and fits into existing workflows. In a large U.S. logistics pilot, fleets using Readi reduced fatigue-linked in-cab telematics events by 42%.
Book a demo to explore how predictive fatigue management software can improve safety and productivity across your fleet.
A driver behavior monitoring system collects and analyzes data from telematics, cameras, and ELDs to track how drivers operate vehicles, identify patterns like harsh braking and speeding, and guide safety interventions. These systems turn raw trip data into driver scorecards, exception alerts, and risk rankings that help fleet managers prioritize coaching and reduce incidents before they occur.
Driver inattention is the most dangerous unsafe driving behavior, playing a role in more than 75% of crashes and about 65% of near-crashes according to naturalistic driving research. Inattention often stems from distraction, fatigue, or drowsiness and shows up first as unstable speed control, late response to traffic, and poor lane discipline before a collision occurs.