
Product News


A fleet driver scorecard is a structured report that measures driver behavior across safety, compliance, and efficiency metrics to help fleet managers identify risk, guide coaching, and track improvement over time. Whether you need a fleet driver scorecard template, a downloadable PDF, or a clear framework for building one from scratch, this guide covers the key driver performance metrics, scoring methods, and practical steps to make scorecards work within your fleet safety management program.
Most fleet driver scorecards pull data from telematics, ELDs, dashcams, and dispatch systems to score each driver against a consistent set of criteria. The specific metrics vary by operation, but strong scorecards cover four categories: safety behavior, regulatory compliance, operational efficiency, and risk trends.
Common driver performance metrics include:
A well-built driver safety scorecard report goes beyond listing events. It weights each metric based on severity, benchmarks individual drivers against fleet averages, and highlights patterns that point to coaching opportunities or elevated risk.
A fleet driver scorecard is a strong tool for fleet performance evaluation, but most scorecards are reactive by design. They summarize what already happened on the road. Harsh braking events, speeding alerts, and camera triggers all reflect risk that has already shown up behind the wheel.
This creates a gap. A driver may score well on last week's scorecard but start their next shift carrying significant sleep debt or circadian misalignment. Standard driver coaching tools and scorecard templates in Excel or PDF format do not account for these biological factors.
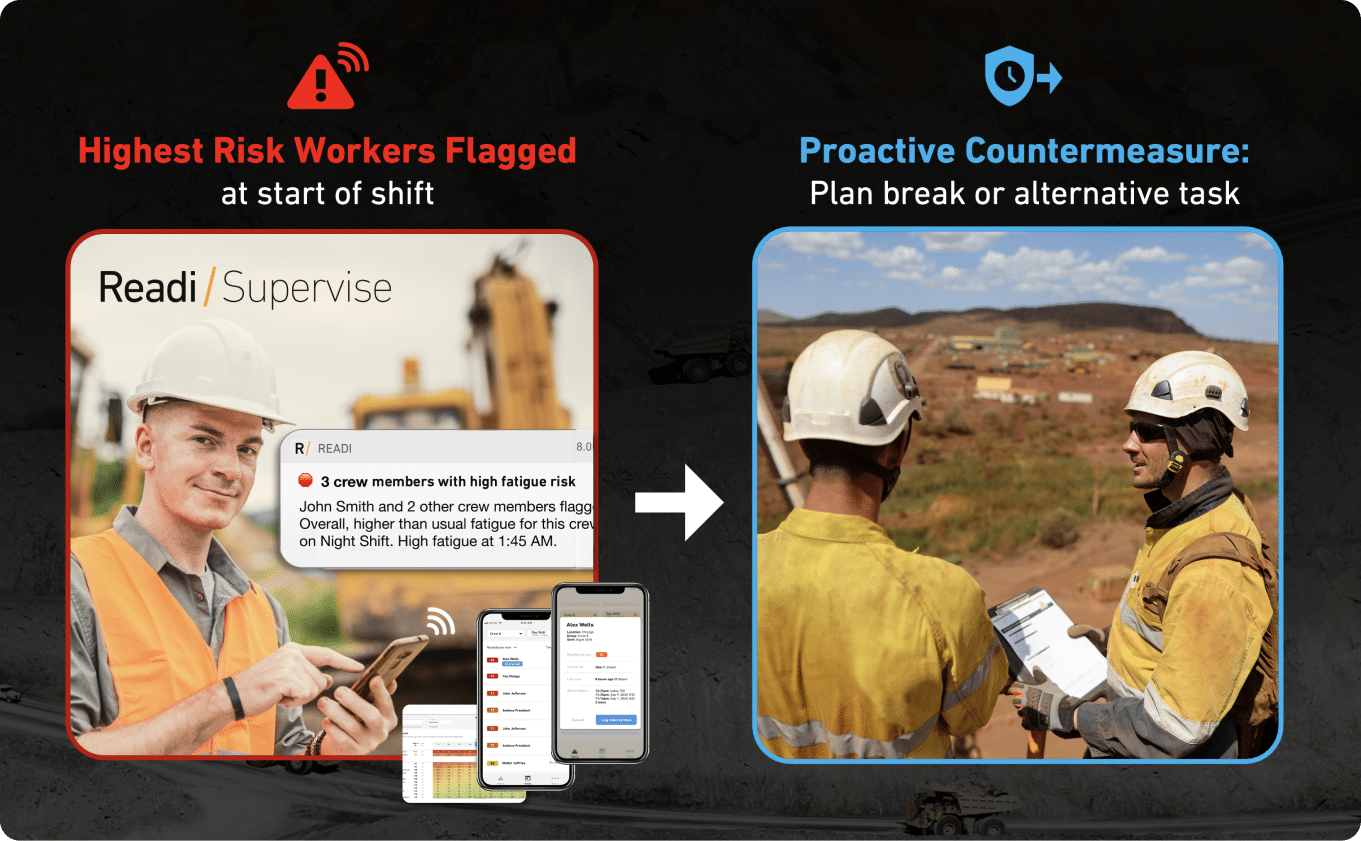
Predictive fatigue management software like Readi addresses this gap by forecasting fatigue-related impairment up to 18 hours in advance, giving supervisors a leading indicator they can act on before a driver's scorecard trends in the wrong direction. Adding a fatigue risk layer to your existing scorecard process turns a reactive report into a more complete driver risk assessment.
In many fleets, the review process starts when an item lands in a manager’s queue: a video clip, an HOS exception, a near-miss note, or a complaint from the public. That approach leaves long stretches with no clear view of how a driver performs across the month, while a fleet driver scorecard creates a standing record that shows drift, consistency, and repeat exposure before a major loss reaches the claims file.
A scorecard gives safety staff, dispatch, terminal leaders, and drivers one operating standard. Late starts, after-hours mileage, route deviation, seat belt exceptions, and other driver performance metrics can be reviewed against the same thresholds, which cuts down on debate and gives supervisor notes a clear basis.
Operating costs often surface in the scorecard before they reach the maintenance budget or fuel report:
A formal scorecard process also strengthens the fleet’s position during renewals, audits, and internal reviews. Weekly score history, trend lines, and documented follow-up show that fleet safety management does not rely on one-off reactions; it uses a repeatable method to rank exposure, assign coaching, and track whether behavior changes after intervention.
Night routes and rotating schedules add another variable that a standard scorecard cannot capture on its own. Readi extends the view by flagging elevated fatigue exposure 18 hours in advance, which gives supervisors time to adjust dispatch timing, task assignment, or rest opportunity before impairment shows up as a safety event.
Metric selection should match the job the scorecard needs to do. A fleet driver scorecard template for overnight linehaul work will not look the same as one built for local delivery, but both should focus on measures supervisors can review, explain, and act on inside a normal coaching cycle.
Safety fields should show how a driver handles speed, spacing, control, attention, and alertness under real route conditions. In a fleet driver scorecard pdf or driver scorecard template Excel file, this section usually carries the most weight because these fields connect most directly to crash exposure.
Compliance fields should capture both clear violations and repeat drift toward a violation. A driver who finishes close to the daily or weekly limit on a regular basis may present more operational strain than a driver with one isolated log issue, so hours-of-service margin belongs in the score along with formal HOS breaches.
DVIR completion also deserves a place in the scorecard because missed or late inspections often signal a weak routine at the start or end of a run. For broader fleet performance evaluation, some fleets track driver-level exposure to enforcement risk through CSA-related measures, uncertified logs, inspection failures, or recurring paperwork defects.
A useful scorecard should also reflect how each driver affects fuel, schedule discipline, and asset use. Idle share, fuel burn by mile, and arrival reliability give operations leaders a clearer picture than safety data alone, especially in fleets where the same driving habits that create risk also raise operating cost.
Look for patterns rather than one-off spikes. Frequent engine-on idle periods, poor mpg on comparable lanes, late route starts, missed appointment windows, and after-hours vehicle movement often point to dispatch friction, route planning gaps, or weak adherence to policy.
Loss data belongs on the scorecard, but it should sit in context. Normalize collision counts by miles traveled, separate minor property damage from injury or tow-away events, and include near-collision or close-call signals captured by video or telematics systems so the driver risk assessment reflects more than finished claims.
Preventability should also appear in this section. A fleet driver scorecard example that shows total incidents without a preventable versus non-preventable split can distort coaching priorities and hide where stronger decisions behind the wheel could have changed the outcome.
A strong fleet driver scorecard starts with one operational choice: what should the score improve first. For a linehaul fleet, that may mean fewer preventable events on night routes; for a service fleet, tighter route control, lower idle waste, or cleaner audit performance may sit at the top.
Pick a small group of driver performance metrics that match that goal and connect each one to a supervisor action. A fleet driver scorecard example built for safety will look different from one built for cost control, so the metric mix should reflect the work, the routes, and the loss patterns the fleet already knows.
After metric selection, score weighting should follow exposure. A seatbelt breach, repeated high-speed events, or a pattern of hard braking in dense traffic should carry more score impact than a small rise in idle time, because claim cost and injury potential do not sit at the same level.
Benchmarks work best when they come from three places: regulation, company policy, and recent fleet results. That method gives the fleet driver scorecard a clear standard for each terminal and reduces arguments over fairness, especially when route length, cargo type, and duty window vary by driver.
A practical scorecard should also pull live data instead of waiting on manual entry. Hours-of-service logs, inspection records, vehicle event feeds, and camera alerts can all feed the same driver safety scorecard report; the supervisor then reviews exceptions, adds route or weather context, and moves to a documented coaching step.
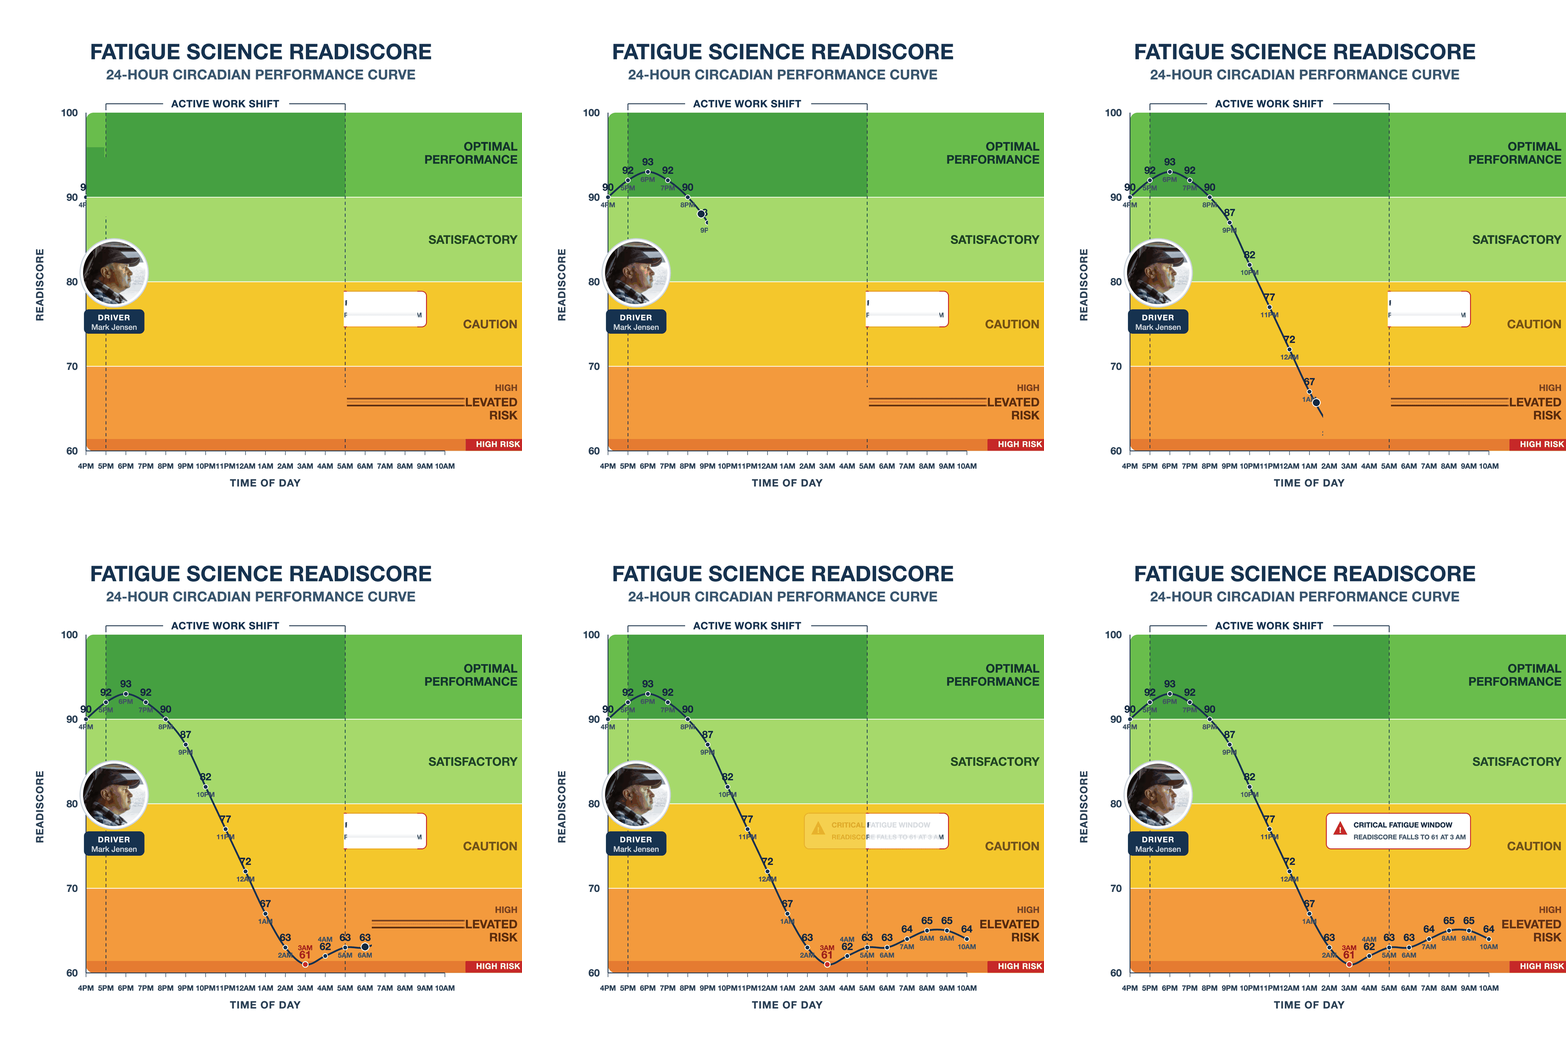
Fleets with overnight dispatch, rotating start times, or long stretches of highway need one more input beyond event counts. Readi provides a fatigue forecast 18 hours in advance, which helps safety and operations sort out whether a score decline points to poor choices, schedule strain, or both.
Set the review rhythm before rollout and keep it steady across the fleet. Weekly or biweekly review usually gives enough data for fleet performance evaluation without long delays, and over time the scorecard becomes part of daily supervisor work instead of another spreadsheet stored after a claim.
Once the scoring model is in place, the real value comes from supervisor action. A fleet driver scorecard should shape who gets attention first, what issue goes into the coaching session, and which risks point to a route or scheduling problem instead of a driver problem.
One alert rarely gives enough context for a fair decision. A stronger method looks at tier movement across several review periods; a driver who stays in yellow for three weeks or drops from green to red after a dispatch change needs a faster response than a driver with one isolated exception.
Recognition should follow the same structure as corrective coaching. A fleet driver scorecard example that highlights clean inspections, steady control on high-speed corridors, and consistent compliance creates a clear standard and shows drivers that the score reflects more than mistakes.
Many fleets use simple color tiers or ranking boards during safety meetings. A short note from a supervisor, peer acknowledgment, or a modest incentive tied to a driver safety scorecard report often improves acceptance faster than discipline alone because drivers can see how daily decisions affect the score.
Scorecards work best as one part of fleet safety management. Dispatch plans, HOS status, maintenance records, camera review, and driver coaching tools all affect how a low score should be read and what action should follow.
A monthly fleet performance evaluation should also sort results by lane, terminal, equipment type, and start time. That review can expose system issues no one-on-one conversation will fix, such as repeated red-tier results on overnight retail runs, poor yard release timing at one location, or shift patterns that place too many drivers in the same fatigue window.
Many scorecard rollouts fail at the design stage. A model with a dozen measures, frequent rule changes, and manual edits in a driver scorecard template Excel file creates noise for supervisors and confusion for drivers. A stronger setup keeps the measure set tight and job-specific, with only the few metrics that reflect the fleet’s actual risk profile.
Another mistake starts with how managers use the score. When the report serves only as a record for discipline, drivers stop treating it as useful feedback. Most driver coaching tools produce better results when supervisors tie low scores to clear event examples, track follow-up actions, and note improvement over a fixed review period.
Some fleets wait for crashes, claims, or severe camera events before they act. That approach misses the pattern that forms first: repeated near misses, rising event counts late in the duty window, or the same unsafe behavior at the same hour across several days. For night routes and long-distance operations, Readi adds useful context by showing fatigue risk 18 hours in advance, which helps supervisors spot impairment risk before it appears as a telematics event.
Another weak point appears when the scorecard sits apart from the rest of the operation. A fleet driver scorecard PDF that does not connect with log data, onboard video, trip history, and dispatch records forces staff to compare screens and rebuild the story by hand. A shared data flow gives safety and operations teams a clearer picture of whether a poor result points to the person behind the wheel, the route plan, or the schedule.
A strong fleet driver scorecard example starts with the operating problem you need to control. A final-mile fleet may care most about backing events, stop density, and late starts; an overnight linehaul fleet may place more weight on lane departures, schedule pressure, and sleep-loss exposure.
Different scorecards should reward different outcomes. A terminal manager who wants fewer claims will not grade the same way as an operations leader who wants tighter route execution or a compliance lead who wants cleaner logs.
A supervisor-ready report should show the score, the reason behind it, and the next step. The best fleet driver scorecard PDF layouts place the current period beside the prior two review windows so a dispatcher or safety lead can spot drift without a second file.
Each page should include a legend for score bands, a small chart for 30-, 60-, and 90-day movement, route or weather notes, and a short field for coach follow-up. Teams that still rely on a driver scorecard template Excel file should lock formulas, define exception rules, and keep one note field for supervisor action so the document stays useful in weekly reviews.
For night freight and long-haul runs, add one field that marks duty periods with high circadian strain or short recovery time between runs. That extra line helps a supervisor separate random errors from behavior clusters that show up after overnight dispatch, split rest, or schedule flips.
Most questions about a fleet driver scorecard come up after the first draft, not before. The sticking points usually involve scoring logic, fairness across routes, and how to handle fatigue exposure that does not show up clearly in a weekly report.
A fleet driver scorecard is a repeatable review format that turns daily driving records into one performance view for each driver. Safety leaders use it to support coaching, document improvement, compare results across terminals or teams, and keep fleet performance evaluation consistent from one review period to the next.
A practical fleet driver scorecard template starts with the realities of the operation: route type, vehicle class, shift timing, and the behaviors that create the highest cost or injury exposure. Most fleets get better results from a short pilot period first, because the first scoring model often needs adjustment once managers see how drivers rank under real conditions.
The strongest driver performance metrics do not just count events. They show whether the behavior is controllable, repeated, and tied to loss exposure. That usually means a mix of safety events, audit-sensitive compliance items, asset-use measures, and a small number of trend indicators such as late-shift volatility, repeated after-hours use, or event clustering by route and dispatch window.
A scorecard improves fleet safety management when it changes supervisor action, not when it sits in a dashboard. Managers can use the record to spot drivers whose results drift over several weeks, match those patterns to route assignments or start times, and schedule coaching while the issue still sits at the near-miss stage instead of the claim stage.
A well-run driver safety scorecard report gives fleets a cleaner process for insurance reviews, incident follow-up, and supervisor accountability. It also helps reduce disputes about favoritism because the standards, thresholds, and coaching records stay visible to both managers and drivers.
A standard scorecard can show signs that often travel with fatigue, such as event spikes on overnight runs, unstable performance after schedule changes, or repeated deterioration late in a duty cycle. Readi adds a forward-looking layer with a fatigue forecast 18 hours in advance and supports decisions about scheduling, task planning, resource allocation, and worker training before driver risk assessment depends on a harsh-braking alert or camera clip alone.
The fleet driver scorecard you build today will only be as strong as the inputs behind it. Telematics, cameras, and ELD data capture what happened on the road. Adding a predictive fatigue layer captures what is likely to happen next. Readi forecasts fatigue risk up to 18 hours in advance, requires no wearables or hardware, and integrates with existing ELD systems so supervisors can act on elevated risk before it reaches the scorecard as a negative trend.
Book a demo to explore how predictive fatigue management software can improve safety and productivity across your fleet.
What is a good driving score for a driver?
A good driving score typically falls between 85 and 100 on a 0-100 scale, though the threshold depends on your fleet's risk profile, route type, and operating conditions—night freight and urban delivery operations often set different benchmarks based on exposure patterns.
What are the KPIs for fleet management?
Fleet management KPIs include harsh braking frequency, speeding events, hours-of-service compliance, fuel efficiency, idle time, preventable collision rates, on-time delivery percentages, and DVIR completion rates—effective scorecards weight these metrics by severity and exposure rather than counting all events equally.
Is a driving score of 92 good?
A score of 92 sits in the acceptable range for most fleets, though context matters—review the specific metrics behind the score to determine whether minor efficiency issues or more serious safety patterns drove the result, and compare against fleet averages for similar routes and duty windows.
How does driver score work?
Driver scores combine weighted metrics from telematics, ELDs, and dashcams into a single 0-100 rating that reflects safety behavior, compliance, and efficiency—each metric carries different weight based on crash risk and operational impact, with thresholds tied to specific coaching actions rather than arbitrary cutoffs.